In this section of the documentation we describe the first steps after starting KNIME Analytics Platform and all of the resources you have on the KNIME Workbench to build your workflows. This chapter also explains how to customize your workbench, configure KNIME to best suit your needs and finally explains data tables.
Workspaces
When you start KNIME Analytics Platform the KNIME Analytics Platform Launcher window appears and you are promoted to define the KNIME workspace, as shown in Figure 1.
| The KNIME workspace is a folder on your local computer to store your KNIME workflows, node settings, and data produced by the workflow. |
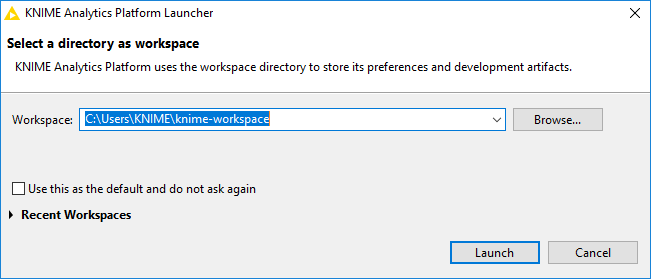
The workflows and data stored in your workspace are subsequently available through the KNIME Explorer in the upper left corner of the KNIME Workbench.
KNIME Workbench
After you have selected a workspace for your project, click Launch. The KNIME Analytics Platform user interface - the KNIME Workbench - opens.
It is typically organized as follows.
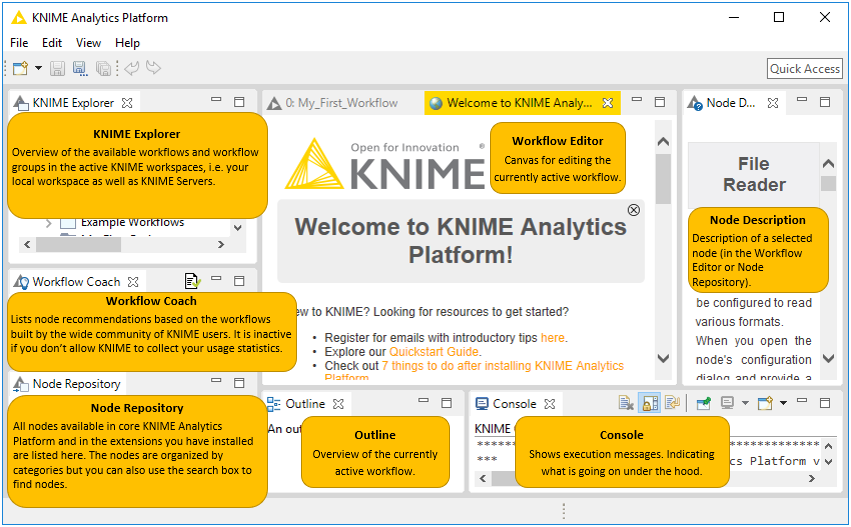
In the next few sections we explain the functionality of and what you can do with these components of the workbench:
Welcome Page
In the middle of the KNIME workbench is the Welcome Page shown in Figure 3.
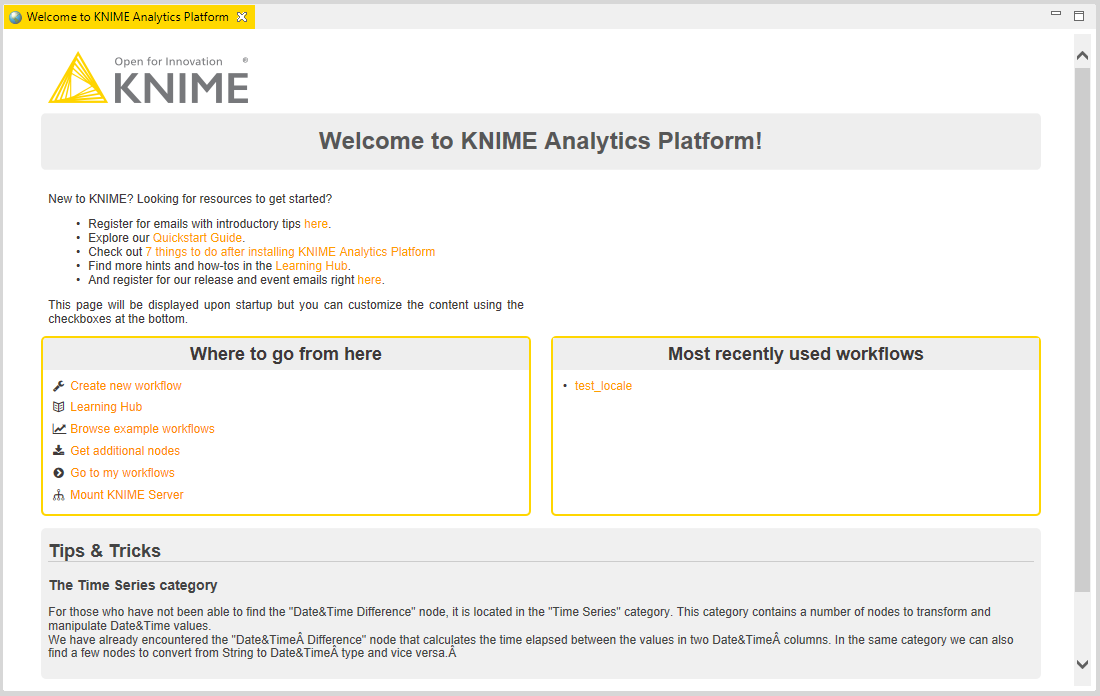
This page links you to information - for example introductory materials on our website, quick links inside the KNIME Workbench such as the most recently opened workflows, and tips and tricks.
If you close the Welcome Page by clicking in the top right hand corner, you are left with an empty canvas. This is your KNIME Workflow Editor.
Workflow Editor & Nodes
The workflow editor is where workflows are assembled. Workflows are made up of individual tasks, represented by nodes.
You create a workflow by dragging nodes from the Node Repository to the workflow editor, then connecting, configuring and executing them.
Nodes
In KNIME Analytics Platform, individual tasks are represented by nodes. Nodes can perform all sorts of tasks, including reading/writing files, transforming data, training models, creating visualizations, and so on.
Facts about Nodes

-
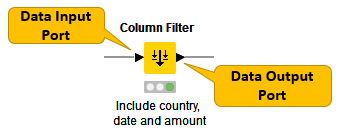
Each node is displayed as a colored box with input and output ports, as well as a status, as shown in Figure 4
-
The input port(s) hold the data that the node processes, and the output port(s) hold the resulting datasets of the operation
-
The data is transferred over a connection from the output port of one to the input port of another node.
| For simplicity we refer to data when we refer to node input and output ports, but nodes can also have input and output ports that hold a model, a database query, or another type explained in Node Ports. |
Changing the Status of a Node
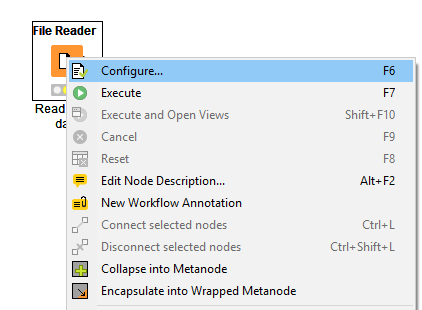
To change the status of a node, you either configure, execute, or reset it. You can find all these options in the context menu of a node shown in Figure 5.
Open the context menu by right clicking a node. From the context menu you can also open output tables and views, as well as copy nodes, along with some more advanced node options.
Identifying the Node Status
The traffic light below each node shows the status of the node. When you configure a node, the traffic light changes from red to yellow, i.e. from "not configured" to "configured".
When you add a new node to the Workflow Editor, its status is "not configured" - shown by the red traffic light below the node.
Configuring the Node
You can configure the node by adjusting the settings in its configuration dialog.
Open the configuration dialog of a node by either:
-
Double clicking the node
-
Right clicking a node and selecting Configure… in the context menu
-
Or, selecting the node and pressing F6
In addition to the task specific settings, each configuration dialog has a:
-
"Memory Policy"-tab: here you can define whether all or only small tables are kept in memory, or if all tables are written to disk.
-
"Flow Variables"-tab: flow variables are explained in the Flow Control Guide
Executing the Node
Some nodes have the status "configured" already when they are created. These nodes are executable without adjusting any of the default settings.
To execute a node, you can either
-
Right click the node and select Execute
-
Or, select the node and press F7
If execution is successful, the node status becomes "executed", which you will see from the green traffic light. If the execution fails, you will see an error sign on the traffic light, and you will have to revise the node settings and the node’s inputs and adjust them as necessary.
You can inspect the outputs, such as data tables, and views of an executed node by right clicking the node and selecting one of the last options in the menu. If the node produces an (interactive) view in its output, like all JavaScript based nodes, you can open it by selecting (Interactive) View: … in the middle of the context menu.
Canceling Execution of the Node
To cancel the execution of a node, right click it and select Cancel or select it and press F9.
Resetting the Node
To reset a node, right click it and select Reset or select it and press F8.
| Resetting a node also resets all of its subsequent nodes in the workflow. Now, the status of the node(s) turns from "executed" into "configured", the nodes' outputs are cleared. |
Node Ports
A node may have multiple input ports and multiple output ports. A collection of interconnected nodes, using the input ports on the left and output ports on the right, constitutes a workflow. The input ports consume the data from the output ports of the predecessor nodes, and the output ports provide data to the successor nodes in the workflow.
Besides data tables, input and output ports can provide other types of inputs and outputs. For each type the pair of input and output port looks different, as shown in Figure 6.
You can only connect an output port to an input port of the same type - data to data, model to model, and so on.
Some input ports can by empty, like the data input port of the Decision Tree View (JavaScript) node in Figure 6. This means that the input is optional, and the node can be executed without the input. The mandatory inputs, shown by filled input ports, have to be provided to execute the node.
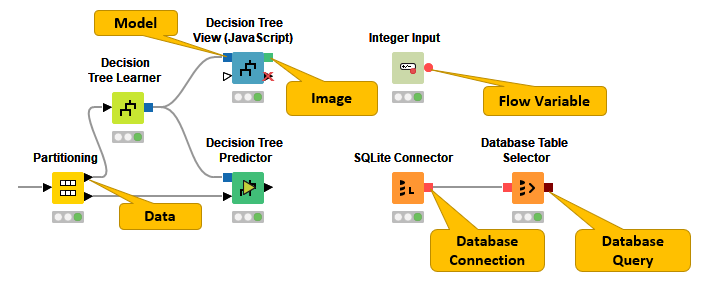
A tooltip gives a short explanation of the input and output ports. If the node is executed, the dimensions of the outcoming data are shown in its data output port. You can find a more detailed explanation of the input and output ports in the node description.
How to select, move, copy, and replace nodes in a workflow
You can move nodes into the workflow editor by dragging and dropping them. To copy nodes between workflows, select the nodes you want to copy, right click the selection, and select Copy in the menu. In the destination workflow, right click the workflow editor, and select Paste in the menu.
To select a node in the workflow editor, click it once, and you will see a border around it. To select multiple nodes, either press Ctrl and select nodes by mouse click, or draw a rectangle over the nodes with the mouse.
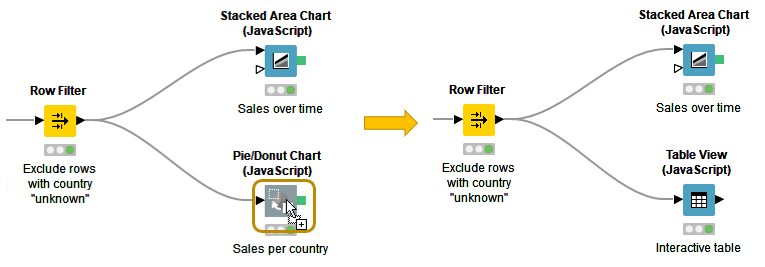
You can replace a node by dragging a new node onto an existing node. Now the existing node will be covered with a colored box with an arrow and boxes inside as shown in Figure 7. Releasing the mouse replaces the node.
Workflow Editor Settings
You can change visual properties of the workflow editor by clicking the "Workflow Editor Settings" button on the toolbar.
In the dialog that opens, you can change the grid size, or remove the grid lines completely. You can also change the connection style from angular to curved, and make the connections thicker or narrower.
The changes will only apply to the currently active workflow editor. If you want to change the default workflow editor settings, go to File → Preferences → KNIME → KNIME GUI → Workflow Editor.
Keyboard Shortcuts
To view a full list of keyboard shortcuts, choose Help → Show Active Keybindings. Here you can view all the keybindings to commands, modify the bindings, and create your own shortcuts.
KNIME Explorer
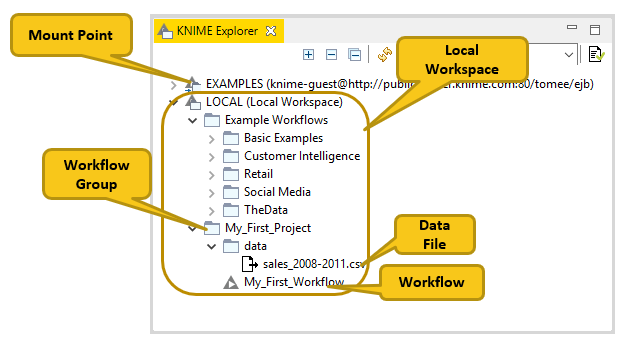
The KNIME Explorer is where you can manage your workflows, workflow groups, and server connections.
Creating a New Workflow
To create an empty workflow, right click anywhere in your local workspace, and
select New KNIME Workflow… in the menu, or use one of the options
explained in Building Workflows.
Give the workflow a name, and define the destination of the new workflow.
Click Finish, and the new workflow will appear in the selected workflow
group in the KNIME Explorer.
If you want to learn how to build a workflow, you can take a look at the next
section Building Workflows, follow the steps in the
Quickstart Guide, or check
the video Workflows and Workflow Groups.
Building Workflows
To create a workflow, you need an empty workflow canvas. You can do any of these things:
-
Select "Create new workflow" on the Welcome Page
-
Navigate to File → New…, and select New KNIME Workflow.
-
Click the leftmost icon in the toolbar
-
Right click in the local workspace and select New KNIME Workflow…
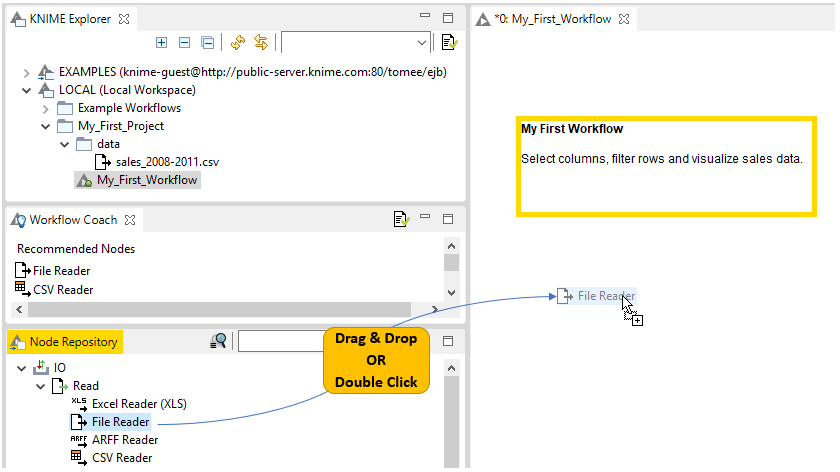
A workflow is built by dragging nodes from the node repository to the workflow editor and connecting them. To add a node from the node repository or from the workflow coach to the workflow editor, you have two options shown in Figure 10:
-
Drag and drop the node into the workflow editor
-
Double click the node
Once you have added two nodes to the workflow editor, you probably want to connect them. There are three ways to connect nodes:
-
Click the output port of the first node and release the mouse at the input port of the second node. Now, the nodes are connected.
-
Select a node in the workflow editor, and then double click the next node in the node repository. This double click creates a new node, and connects it to the selected node in the workflow editor.
-
Select the nodes you want to connect in the workflow editor and press "Ctrl + L".
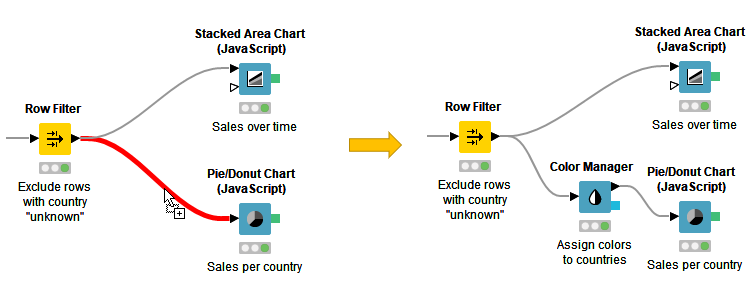
If you want to add a node between two nodes in a workflow, you do not have to disconnect them. Just drag the node from the node repository, and release it on its place in the workflow when the connector has turned red, as shown in Figure 11. The red connection means that it is ready to accept the new node when you release the mouse.
Mount Points
Mount points are workflow repositories that are accessible from KNIME Analytics Platform. They can be displayed as root directories in the KNIME Explorer view.
Each mount point consists of the location of the workflow repository, and a mount ID. For a local workflow repository, the location is the path to the folder, and for a server it is the address of the server. The mount ID is used to reference files and workflows under the mount point.
knime:// Protocol
First of all, knime:// protocol is a protocol specific to KNIME that allows
you to specify file paths relatively to the KNIME workspace or even the location
of the currently executing workflow.
The first element in the file path after knime:// is the base for the path.
It is either the workflow itself, the current mount point or a specific
mount point like LOCAL in the following example:
knime://LOCAL/My_First_Project/data/sales_2008-2011.csv
|
The portable file path options are explained in the subsections below and in this video: The knime:// Protocol. |
Absolute Paths
Absolute paths are defined relative to a specific mount point. The following
file path is defined using the absolute path to the file based on the mount point
LOCAL:
knime://LOCAL/My_First_Project/data/sales_2008-2011.csv
The file path would now work on any system where the workflow is saved in the local workspace, and the file path inside the local workspace folder is the same.
Mountpoint-relative Paths
Because of the LOCAL term in the absolute path, accessing the file with the
absolute path is not possible, if the workflow is deployed to a server.
To enable access to a data file both locally and on a server, you can define the path to the file relative to the currently active mount point.
You do this by changing the LOCAL term in the file path to knime.mountpoint
as in this file path:
knime://knime.mountpoint/My_First_Project/data/sales_2008-2011.csv
In the mountpoint-relative file path, the knime.mountpoint refers to the
uppermost folder level, which can be LOCAL or the mount ID of a server.
Workflow-relative Path
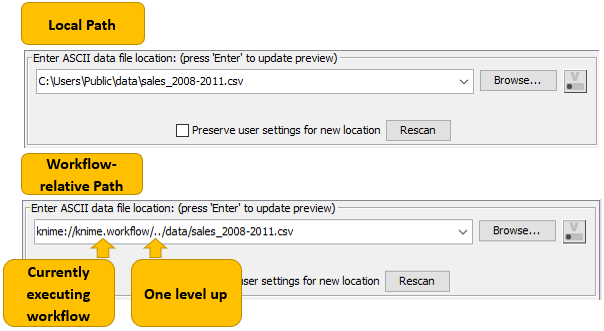
The most flexible portable file path is the workflow-relative path. A workflow-relative path defines the file path relative to the currently executing workflow. Using this file path you can access data files in workflows in local workspaces on different systems, or on a server, as long as the folder structure between the workflow and the data file is the same.
Compared to the absolute path and mountpoint-relative path, the name of the
folder containing the workflow does not have to be the same in the different
locations. That’s because an upper folder level is denoted by /../ instead of
the name of the folder.
Workflow Groups
Multiple workflows can be organized into workflow groups. Workflow groups are folders in the KNIME workspace that can include multiple workflows, as well as associated datafiles, metanode templates, and even other workflow groups.
The workflow groups in the currently active local workspace are shown under the
LOCAL mount point in the KNIME Explorer.
There are three ways to create a new, empty workflow group:
-
Right click in your local workspace in the KNIME Explorer, and select New Workflow Group… in the menu
-
Click the arrow next to the leftmost icon in the toolbar and select New KNIME Workflow Group
-
Navigate to File → New…, select New KNIME Workflow Group in the list, and click Next.
In the dialog that opens, give the folder a name, and define where in your local workspace you want to save the folder. Click Finish. Now the new folder will appear in the selected destination in the KNIME Explorer.
Import/Export Workflows
You have two options to export a workflow:
-
You can export it as a file
-
Or, you can deploy it to a server (requires a license)
In the same way, you can also import a workflow:
-
Import a file containing a workflow into your local workspace
-
Or, save a workflow on a server to your local workspace. Accessing the EXAMPLES Server does not require any credentials, and you can save the workflows there to your local workspace.
How to Import and Export a Workflow (or Workflow Group)
To import or export a workflow or a workflow group, you can:
-
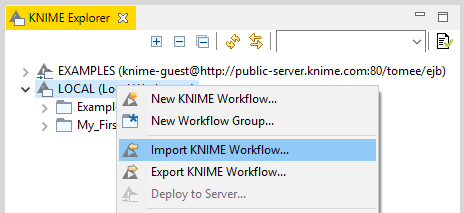
Right click anywhere in the local KNIME workspace, and select Import (Export) KNIME Workflow…, as shown in Figure 13.
-
Or, go to File menu and select Import (Export) KNIME Workflow…
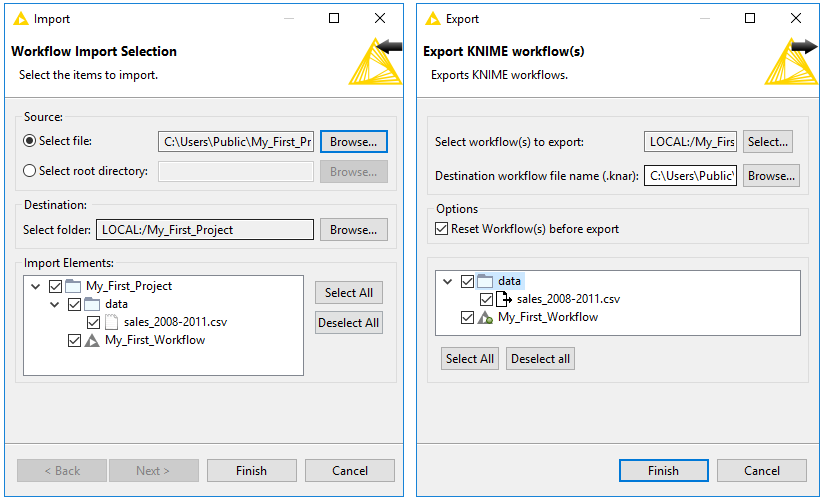
The dialog shown in Figure 14 opens.
Importing a Workflow
In the upper part of the "Import" dialog, select the items to import, i.e define the file or directory path to import. In the "Destination" field underneath, define the destination folder in the KNIME workspace you want to import to.
If you import a workflow group, you will see a list of elements inside the workflow group in the lower part of the dialog. Here you can select single elements to import.
Exporting a Workflow
In the upper part of the "Export" dialog, select the workflow (or group) you want to export. In the "Destination" field underneath, define the path to the destination folder on your system, and the name of the file.
In "Options" you can choose to reset the workflow(s) before exporting. When you reset a node, the node status changes from "executed" to "configured", and the output of the node will not be available any more. If you export a workflow in an executed state, the data used in the workflow will be exported as well. See the section on Reset and Logging for more information.
If you export a workflow group, you can select which elements the exported file will contain.
|
Importing and exporting workflows are also introduced in this video: Import/Export Workflows. |
-
The file extension for a KNIME workflow, is
.knwf(KNIME workflow file) -
The file extension for a workflow group, is
.knar(KNIME archive file)
EXAMPLES Server
You can explore example workflows - including real-world use cases - on the public EXAMPLES server.
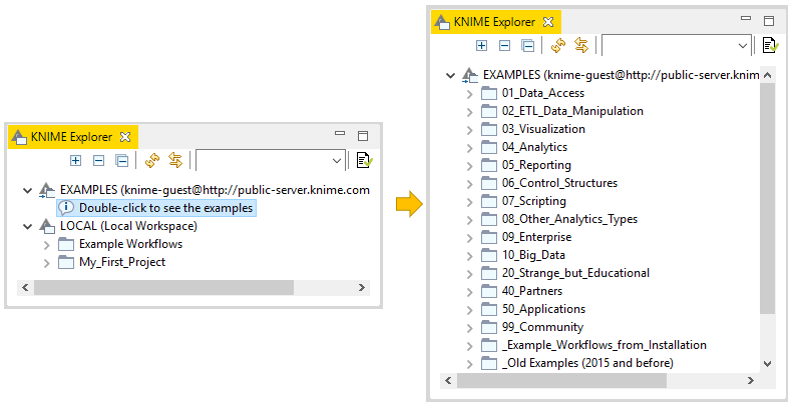
Inspect the workflow groups for different categories by expanding the EXAMPLES mount point in the KNIME Explorer, and then double clicking the text below as shown in Figure 15.
To download an example workflow:
-
Drag and drop
-
Or, copy and paste
the workflow into your LOCAL workspace. Double click the downloaded copy of the example workflow to open and edit it like any other workflow.
Alternatively, double click the example workflow directly on the EXAMPLES server to open it in the workflow editor. Save it to your LOCAL workspace via "File" and then "Save As…".
|
The video The EXAMPLES Server provides a more detailed introduction to the EXAMPLES server. |
Workflow Coach
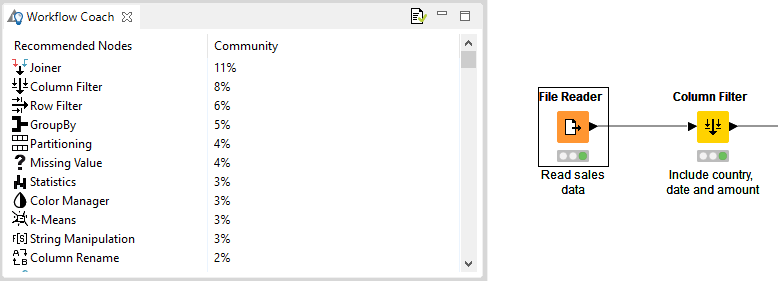
The workflow coach shown in Figure 16 provides node recommendations. If you have selected a node in the workflow editor, the workflow coach shows the most popular nodes to follow the selected node. If you have not selected any node, the recommendations represent the most popular nodes to start a workflow.
The recommendations are based on KNIME community usage statistics about workflows built in KNIME Analytics Platform. You can add nodes from the workflow coach to the workflow editor in the same way as you would from the node repository - by drag and drop, or by a double click.
Note: start or stop sending anonymous usage data any time by checking the option Yes, help improve KNIME. in the "KNIME" dialog in Preferences.
Customizing node recommendations
Customize the node recommendations in the "Workflow Coach" dialog, which you
find by navigating to File → Preferences → KNIME → Workflow
Coach.
You have these three options:
-
Add node recommendations based on workflows in the currently active local workspace by enabling the Workspace Node Recommendations option in the "Workspace Recommendations" dialog.
-
Add node recommendations based on the workflows on a server by selecting the KNIME Server in the "Server Recommendations" dialog
-
Disable the node recommendations by the community by unchecking the Node Recommendations by the Community option in the "Workflow Coach" dialog
|
The video Workflow Coach: The Wisdom of the KNIME Crowd provides a more detailed introduction to node recommendations. |
Node Repository
Currently installed nodes are available in the node repository where they are organized under different categories. You can add a node from the node repository into the workflow editor by drag and drop, or by a double click, as we explain in the section Building Workflows.
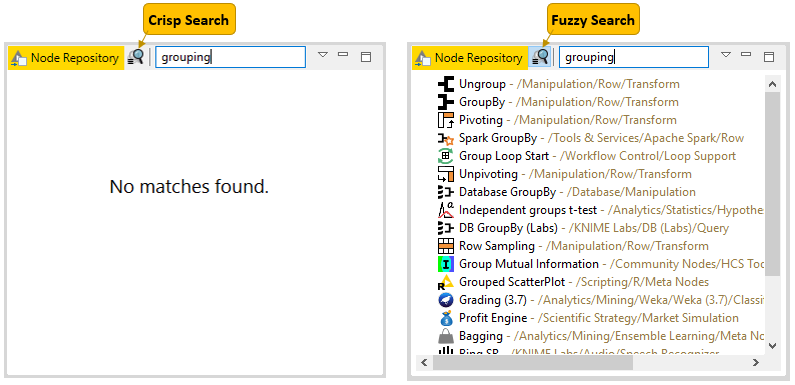
You can search for a node by expanding the categories or by typing a search term in the search field on top of the node repository, as shown in Figure 17. The default search mode is crisp search. Using this search mode, the interface will return all the nodes that either have the search term in their names, or they are in a subcategory whose name include the search term.
You can switch the search mode to fuzzy search by clicking the icon next to the search field. Using this search mode, the interface will return all the nodes that are related to the search term.
|
An introduction to the node repository is also available in the video Node Repository. |
Node Description
The node description panel on the right of the KNIME Workbench shown in Figure 2 provides a description of the node selected in the node repository or workflow editor. The first part is a general description, followed by the available setting options, and finally a list of input and output ports.
Outline
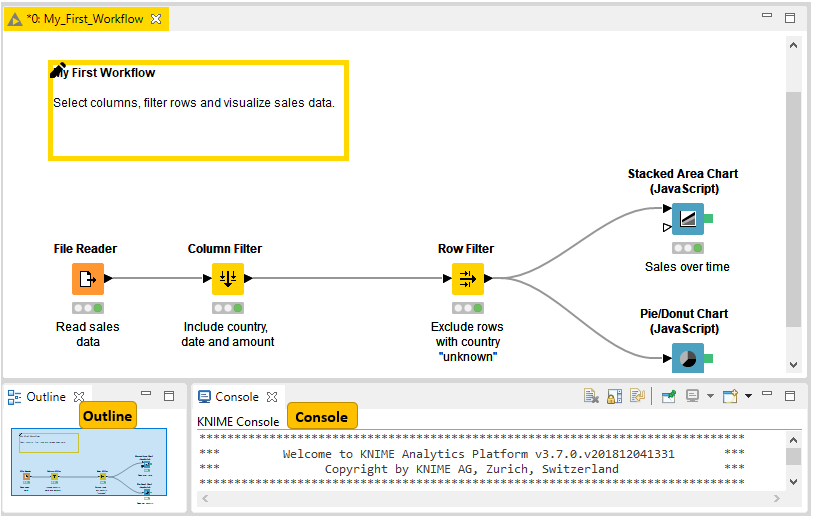
In the outline on the bottom part of the KNIME Workbench shown in Figure 18, you see an overview of the currently active workflow. If the whole workflow does not fit in the workflow editor, you can change the active area by scrolling the blue, transparent rectangle.
Console
The console on the bottom part of the KNIME Workbench shown in Figure 18 shows all warning and error messages related to the workflow execution - indicating what is going on under the hood. If you want debug and log information messages to be reported in the console, you can change the log file log level in File → Preferences → KNIME.
Customizing the KNIME Workbench
Node Monitor
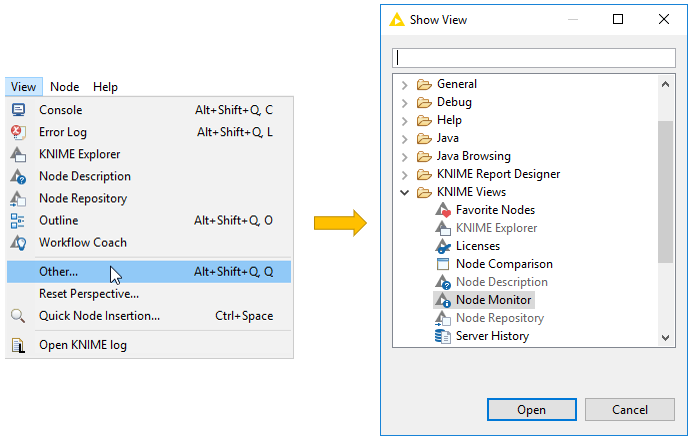
If you want to inspect intermediate output tables in your workflow, you can add a Node Monitor panel into your KNIME workbench. Go to View → Other → KNIME Views, and you will find the Node Monitor item in the list of available views, as shown in Figure 19.
After adding the panel to the workbench, select Show Output Table in the menu in the upper right corner of the node monitor panel, as shown in Figure 20. Now, this panel will show the output table of the node you have selected in the workflow editor.

Besides the output table, you can also have the node monitor panel to show the available flow variables in the node output, or the execution time of the node. Or, you can pin the output of one node. This means that the output of the pinned node is shown independently of the selection in the workflow editor.
Reset and Logging
When you reset a node, the node status changes from "executed" to "configured", and the output of the node will not be available any more. If you save a workflow in an "executed" state, the data used in the workflow will be saved as well. That is, the larger the dataset, the larger the file size. Therefore, resetting workflows before saving them is recommended if you can access the dataset without any restrictions.
A reset workflow only saves the node configurations, and not any results.
However, resetting a node does not undo the operation executed before. All
operations done during creation, configuration, and execution of a workflow are
reported in the knime.log file.
You can inspect the knime.log file by going to View → Open KNIME
log. The log file opens in the workflow editor. The knime.log file has a
limited size, and after reaching it the rows will be overwritten from the top.
You can also find the knime.log file in the knime-folder inside the
.metadata-folder, which you will find in the KNIME workspace folder you
defined when launching KNIME Analytics Platform.
Show Heap Status
The heap status panel shows the memory usage during the execution of a workflow, and helps you to monitor memory usage for your project. To add the heap status panel to the workbench, go to File → Preferences. In the dialog that opens, click General, select Show heap status, and click Apply and Close.
A heap status bar showing the memory usage appears in the bottom right part of the status bar, directly below the console panel. Next to the heap status bar is the "Run Garbage Collector" button, which you can click to manually allocate and free up memory.
Configuring KNIME Analytics Platform
Preferences
You can adjust the default settings in KNIME Analytics Platform in Preferences. Go to File → Preferences, and in the dialog that opens, you will find a list of subcategories. Each category contains a separate dialog for specific settings like database drivers, available update sites, and appearance.
KNIME
Select KNIME in the list of subcategories, and you can define the log file log level. By default it is set to DEBUG. This log level helps developers to find reasons for any unexpected behavior.
Directly below, you can define the maximum number of threads for all nodes. Separate branches of the workflow are distributed to several threads to optimize the overall execution time. By default the number of threads is set to twice the number of CPUs on your machine.
In the same dialog, you can also define the directory for temporary files.
By checking the last option Yes, help improve KNIME., you agree to sending us anonymous usage data. Your agreement activates the node recommendations by community in the Workflow Coach.
KNIME GUI
If you expand the KNIME category, you will find a subcategory KNIME GUI. In this dialog, you can define the console view log level. By default it is set to "WARN", because more detailed information is only useful for diagnosis purposes.
Further below, you can select which confirmation dialogs are shown when you use KNIME Analytics Platform. Choose from the following:
-
Confirmation after resetting a node
-
Deleting a node or connection
-
Replacing a connection
-
Saving and executing workflow
-
Loading workflows created with a nightly build
In the same dialog, you can define what happens if an operation requires executing the previous nodes in the workflow. You have these three options:
-
Nodes are executed automatically
-
The node execution is always rejected
-
Show a dialog to execute or not
The following options allow you to define if workflows are saved automatically and after which time interval and if linked metanodes are automatically updated, among some visual properties like the border width of the workflow annotations.
Master Key
If you use credentials in your workflow, you can encrypt them using a Master Key. Once you enter for example your credentials for different database connections in a workflow, you do not need to save them together with the workflow, nor do you need to enter them every time you open the workflow. Instead, you just provide the Master Key.
Setting up knime.ini
When installing KNIME Analytics Platform, configuration options are set to their defaults. The configuration options, i.e. options used by KNIME Analytics Platform, range from memory settings to system properties required by some extensions.
The default settings can be changed in the knime.ini file. You can find the
knime.ini file in the installation folder of KNIME Analytics Platform.
|
To locate the |
The knime.ini file can be edited with any plaintext editor, such as Notepad
(Windows), TextEdit (MacOS) or gedit (Linux).
The entry -Xmx1024m in the knime.ini file specifies how much memory KNIME
Analytics Platform is allowed to use. The setting for this value will depend on
how much memory is available in your machine. KNIME recommends setting it to
approximately one half of your available memory, but you can modify the value
based on your needs. For example, if your computer has 16GB of memory, you might
set the entry to -Xmx8G.
Besides the memory available, many other settings can be defined in the
knime.ini file. Table 1 provides an overview of some of the most
common settings, and
here
you can access a complete list of the configuration options.
| Setting | Explanation | Default value | Possible Values |
|---|---|---|---|
|
RAM available for KNIME Analytics Platform |
|
Depends on your machine |
|
Temporary data saved in compressed format or not. For simple operations, setting it to “false” may lead to a better performance, though at the expense of temporary disk space. |
|
|
|
Define the size of a small table for the configuration option Keep only small tables in memory in any configuration dialog. By increasing the size of a "small table", you can limit the number of swaps to the disk, but at the same time limit the memory space available for other operations. |
|
|
|
When trying to connect or read data from an URL, this value defines a timeout for the request. Increase the value if a reader node fails. A too high timeout value may lead to slow websites blocking dialogs in KNIME Analytics Platform. |
|
|
KNIME Tables
Data Table
Very common input and output ports of nodes are data input ports and data output ports, which you can recognize from the black triangles in Figure 21.
A data table is organized by columns and rows, and it contains a number of equal-length rows. Elements in each column must have the same data type.
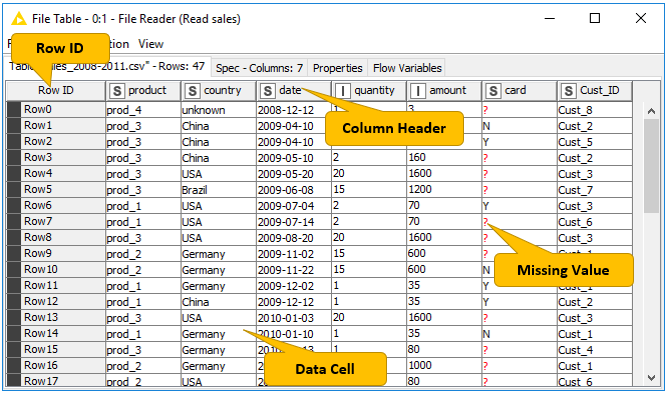
The data table shown in Figure 22 is produced by the File Reader node, which is one of the many nodes with a black triangle output port for data output. To open the table, right click the node and select the last item File Table in the menu. The output table has unique row IDs and column headers. The row IDs are automatically created by the reader node, but they can also defined manually. The row IDs and the column headers can therefore be used to identify each data cell in the table. Missing values in the data are shown by a question mark.
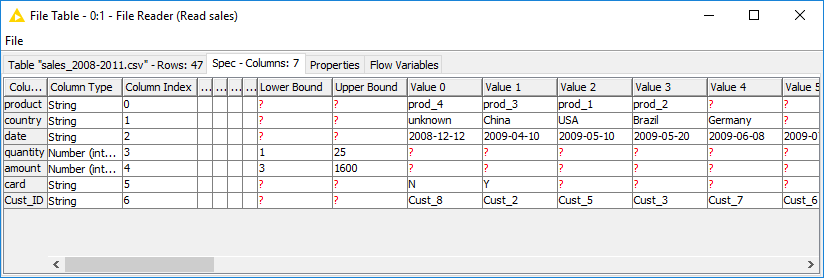
Besides the data table, the node output contains the default "Table" tab, "Spec" tab, "Properties" tab, and "Flow Variables" tab. The "Table" tab shows the contents of the table. The "Spec" tab shows the meta information of the table, including the column name, column type, and optional properties like the domain of the values in the column. In the "Properties" tab, you can see possible metadata related to some columns, for example the width of the histogram in the "Histogram" column produced by the Statistics node. The "Flow Variables" tab shows the available flow variables in the node output and their current values.
|
In the video Data Table Structure we introduce the data organization and data representation in KNIME Analytics Platform in more detail. |
Column Types
The basic data types in KNIME Analytics Platform are Integer, Double, and
String, along with other supported data types such as Long, Boolean
value, JSON, URI, Document, Date&Time, Bit vector, Image, and
Blob. KNIME Analytics Platform also supports customized data types - for
example, a representation of a molecule.
If you click on the "Spec" tab in an output table, you will see the data types of the columns in the data table, as well as the domain of the values in the columns, as shown in Figure 23. For numerical values you will see the range of the values in the data. For string values, you will see the different values appearing in the data.
The reader nodes in KNIME Analytics platform assign a data type to each column based on their interpretation of the content. If the correct data type of a column is not recognized by the reader node, you can convert the data type afterwards. The nodes to convert data types are for example String to Number, Number to String, Double to Int, String to Date&Time, String to JSON, and String to URI.
Many of the special data types are recognized as String by the reader nodes.
To convert these String columns to their correct data types, you can use the
Column Type Auto Cast node.
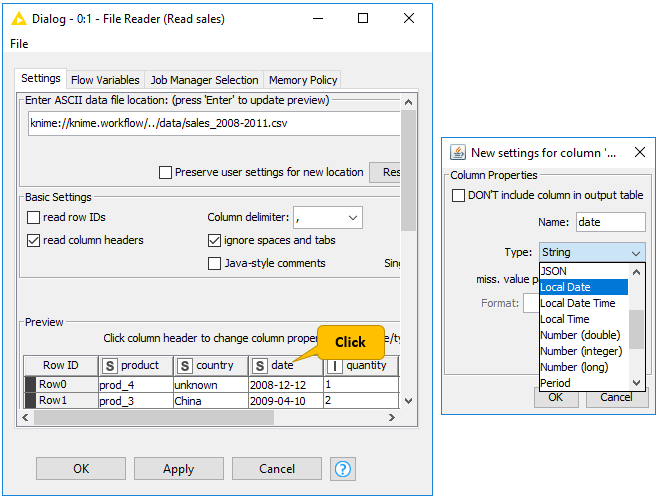
If you use the File Reader node to read a file, you can convert the column types directly in the configuration dialog. You do this by double clicking a column header in the preview and changing the column type in the dialog that opens, as shown in Figure 24.
Sorting
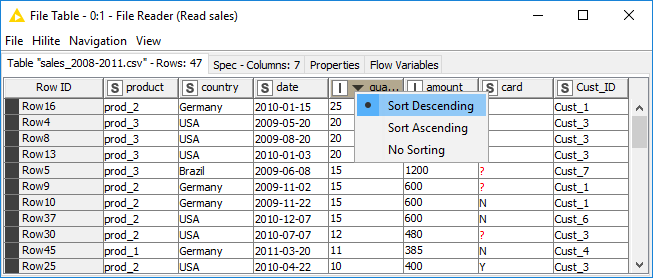
You can sort rows in the table view output by values in one column by clicking the column header and selecting Sort Descending or Sort Ascending as shown in Figure 25. Note that this sorting only affects the current output view, and has no effect on the node output.
To sort rows in an output table permanently, you can use the Sorter node. With the Column Resorter node you can reorder columns.
Column Rendering
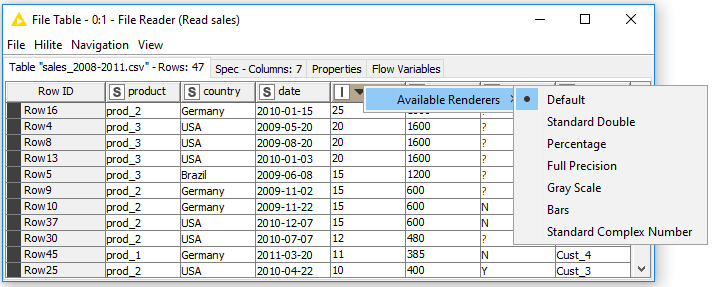
In a table view output, you can change how numeric values are displayed in a data table. For example, it is possible to display numeric values as percentages, or with full precision. You can even replace digits by a color scale or bars. To see these and other rendering options for a column, right click the column header, and select Available Renderers as shown in Figure 26. Note that these changes are temporary, and have no effect on the node output.

Comments and Annotations
You have two options to document your workflow (shown in Figure 8) in the workflow editor:
Add a comment to an individual node by double clicking the text field below the node and editing the text.
Add a general comment to the workflow, right click the workflow editor and select New Workflow Annotation in the menu. Now a yellow box will appear in the workflow editor.
To edit the workflow annotation box, you can:
Move the workflow annotation box inside the workflow editor by first activating it from the top left corner, and then dragging the box.
Resize the box by dragging any of its edges.
Edit the text inside by double clicking the top left corner of the annotation box and typing new text in the text field.
Change the properties of the text and the border by double clicking in the top left corner and then right clicking inside the box. A menu will open showing the available editing options.
In the video Annotations & Comments we give you a few hints about how to document your workflow.