Introduction
KNIME Analytics Platform is open source software for creating data science applications and services. Intuitive, open, and continuously integrating new developments, KNIME makes understanding data and designing data science workflows and reusable components accessible to everyone.
With KNIME Analytics Platform, you can create visual workflows with an intuitive, drag and drop style graphical interface, without the need for coding.
In this quickstart guide we’ll take you through the KNIME Workbench and show you how you can build your first workflow. Most of your questions will probably arise as soon as you start with a real project. In this situation, you’ll find a lot of answers in the KNIME Workbench Guide, and in the E-Learning Course on our website. But don’t get stuck in the guides. Feel free to contact us and the wide community of KNIME Analytics Platform users, too, at the KNIME Forum. We are happy to help you there!
Start KNIME Analytics Platform
If you haven’t yet installed KNIME Analytics Platform, you can do that on this download page. For a step by step introduction, follow this Installation Guide.
Start KNIME Analytics Platform and when the KNIME Analytics Platform Launcher window appears, define the KNIME workspace here as shown in Figure 1.
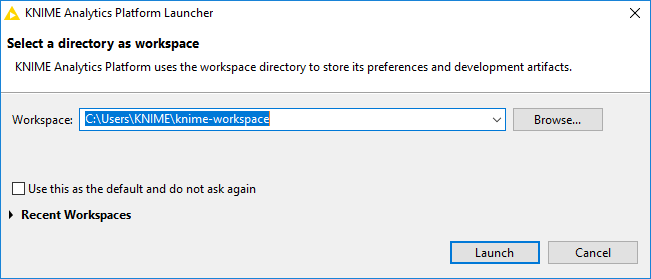
The KNIME workspace is a folder on your local computer to store your KNIME workflows, node settings, and data produced by the workflow. The workflows and data stored in your workspace are available through the KNIME Explorer in the upper left corner of the KNIME Workbench.
After selecting a folder as the KNIME workspace for your project, click Launch. When in use, the KNIME Analytics Platform user interface - the KNIME Workbench - looks like the screenshot shown in Figure 2.
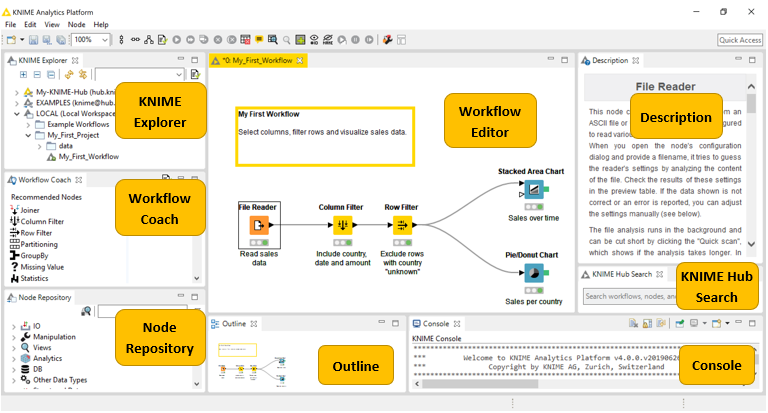
The KNIME Workbench is made up of the following components:
-
KNIME Explorer: Overview of the available workflows and workflow groups in the active KNIME workspaces, i.e. your local workspace as well as KNIME Servers.
-
Workflow Coach: Lists node recommendations based on the workflows built by the wide community of KNIME users. It is inactive if you don’t allow KNIME to collect your usage statistics.
-
Node Repository: All nodes available in core KNIME Analytics Platform and in the extensions you have installed are listed here. The nodes are organized by categories but you can also use the search box on the top of the node repository to find nodes.
-
Workflow Editor: Canvas for editing the currently active workflow.
-
Description: Description of the currently active workflow, or a selected node (in the Workflow Editor or Node Repository).
-
Outline: Overview of the currently active workflow.
-
Console: Shows execution messages indicating what is going on under the hood.
| A more detailed explanation of the different views in the KNIME Workbench is provided in the KNIME Workbench Guide, as well as on the introductory video The KNIME Workbench. |
Nodes and Workflows
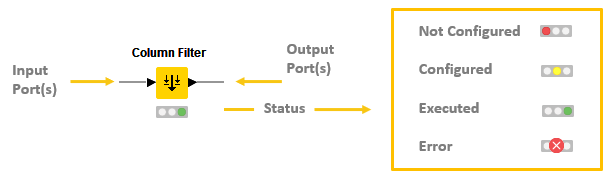
In KNIME Analytics Platform, individual tasks are represented by nodes. Each node is displayed as a colored box with input and output ports, as well as a status, as shown in Figure 3. The input(s) are the data that the node processes, and the output(s) are the resulting datasets. Each node has specific settings, which we can adjust in a configuration dialog. When we do, the node status changes, shown by a traffic light below each node. Nodes can perform all sorts of tasks, including reading/writing files, transforming data, training models, creating visualizations, and so on.
A collection of interconnected nodes constitutes a workflow, and usually represents some part - or perhaps all - of a particular data analysis project.
Build Your First Workflow
Let’s now start building an example workflow, where we analyze some sales data. When we’re finished it will look like the workflow shown in Figure 4. Don’t worry if you get stuck along the way, the finished workflow is also available on the KNIME Hub here.
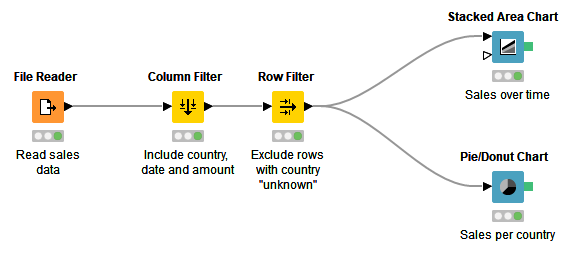
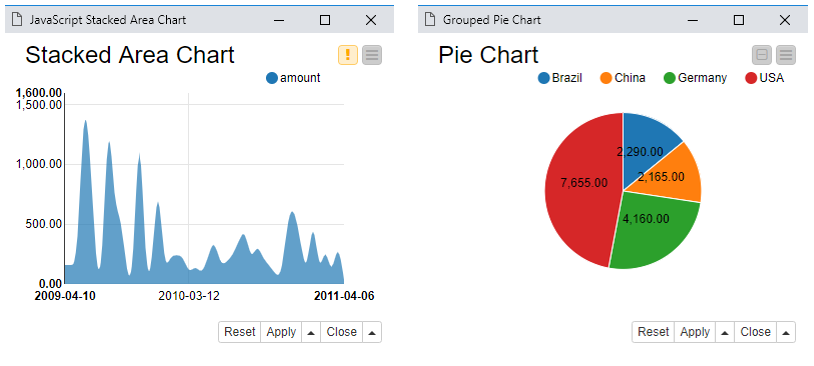
The example workflow in Figure 4 reads data from a CSV file, filters a subset of the columns, filters out some rows, and visualizes the data in two graphs: a stacked area chart and a pie chart, which you can see in Figure 5: one showing the development of sales over time, and the other showing the share of different countries on total sales.
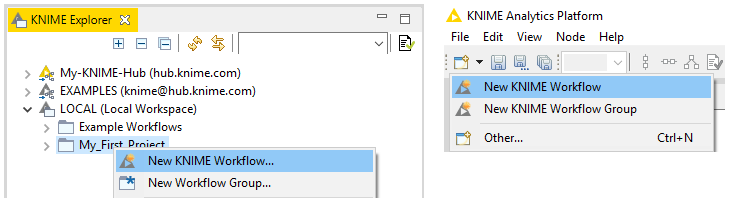
To get started, first download the CSV file that contains the data that we are going to use in the workflow. You can find it here. Next, create a new, empty workflow by:
-
Clicking New in the toolbar panel at the top of the KNIME Workbench
-
Or by right clicking a folder of your local workspace in the KNIME Explorer, as shown in Figure 6
The first node you need is the File Reader node, which you’ll find in the node repository. You can either navigate to IO → Read → File Reader, or type a part of the name in the search box in the node repository panel.
To use the node in your workflow you can either:
-
Drag and drop it from the node repository to the workflow editor
-
Or double click the node in the node repository. It automatically appears in the workflow editor.
Let’s now define the settings for this node:
-
Open the configuration dialog either by double clicking the File Reader node, or by right clicking it and selecting Configure… as shown in Figure 7.
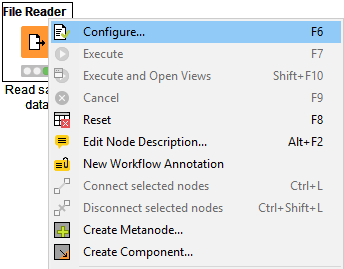 Figure 7. Configuring a node
 -
In the configuration dialog, define the file path by clicking the Browse button, then check other available settings, and preview the data as shown in Figure 8.
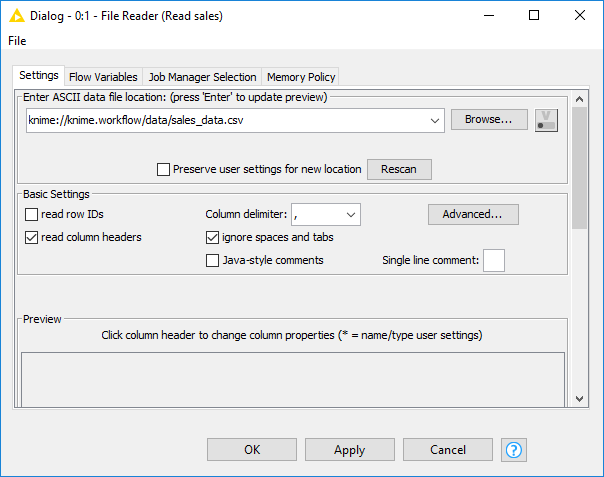 Figure 8. Configuration dialog of the File Reader node
You may now want to inspect the output table to see if the data file was read as you intended. To inspect the output table:
-
Execute the File Reader node by right clicking the node and selecting Execute
-
Open the output table by right clicking the executed node and selecting the last option in the menu: File Table
If the data was read in correctly, add the Column Filter node to the workflow editor and connect it to the File Reader node:
-
Click the output port of the File Reader node, holding the mouse button and releasing it at the input port of the Column Filter node
-
Alternatively, select the File Reader node by clicking it once in your workflow, and then double clicking the Column Filter node in the node repository. This method automatically connects the Column Filter node to the File Reader node.
Before you proceed, you must configure the Column filter node:
-
Move the columns "country", "date", and "amount" into the green-framed Include field either by double clicking them, or using the buttons between the Exclude and Include fields in the configuration dialog shown in Figure 9
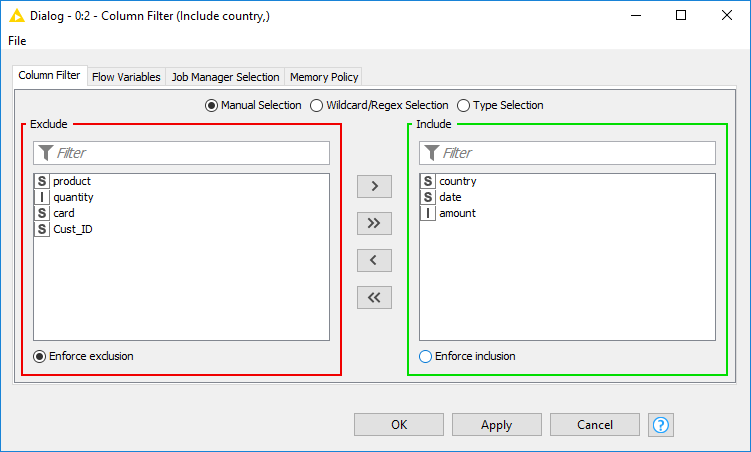 Figure 9. Configuring the Column Filter node
 -
Finish the configuration by clicking OK
Continue building the workflow:
-
Adding the Row Filter node to the workflow editor and connecting it to the Column Filter node
-
Open the configuration dialog of the Row Filter node and exclude rows from the input table where the column "country" has the value "unknown" as shown in Figure 10
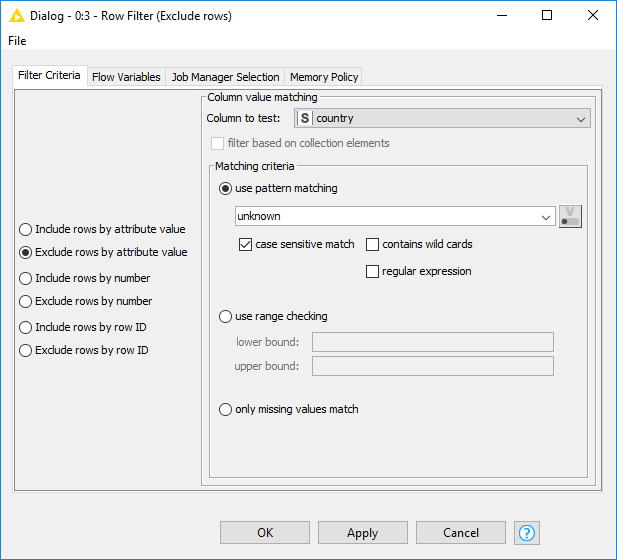 Figure 10. Configuring the Row Filter node
Now that the data has been filtered, let’s move on to data visualization:
-
Search for the nodes Stacked Area Chart (JavaScript) and Pie/Donut Chart (JavaScript) in the node repository, and add them to the workflow editor, both connected to the Row Filter node
-
Open the configuration dialog of the Stacked Area Chart (JavaScript) node. Select the column "date" as the x-axis column as shown in Figure 11.
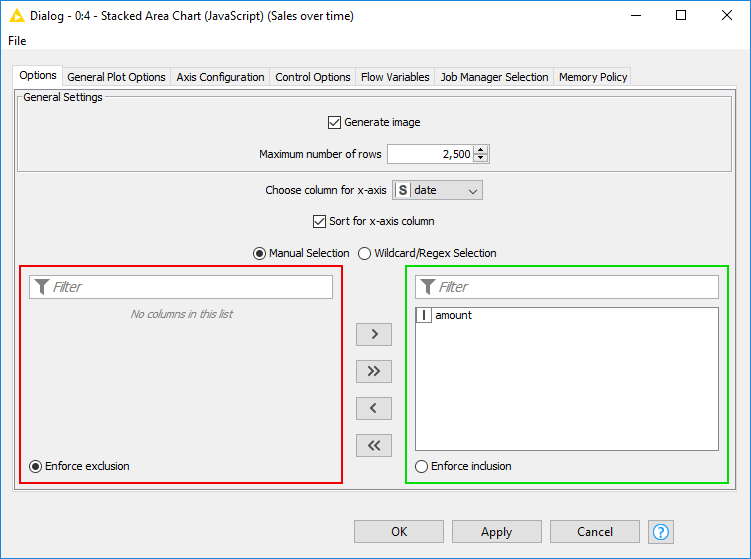 Figure 11. Configuring the Stacked Area Chart (JavaScript) node
 -
Now open the configuration dialog of the Pie/Donut Chart (JavaScript) node and select "country" as category column, "Sum" as aggregation method, and "amount" as frequency column for the pie chart. Both of these configuration options are shown in Figure 12.
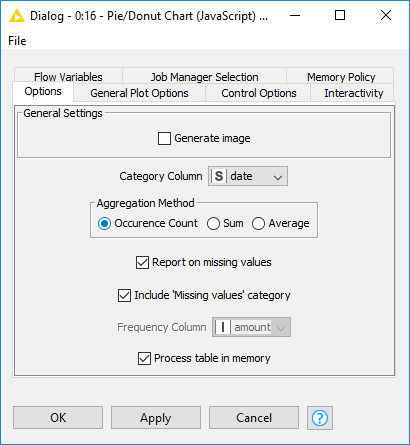 Figure 12. Configuring the Pie/Donut Chart (JavaScript) node
The workflow is finished, and the next step is to execute it and view the output. You do this either by clicking the "Execute all executable nodes" button in the toolbar shown in Figure 13…

…, or by selecting the last nodes of the different branches of the workflow, right clicking the selection, and then clicking Execute in the menu.
To inspect the interactive output view of a JavaScript based node:
-
Choose the Execute and Open Views option for an unexecuted node as shown in Figure 14
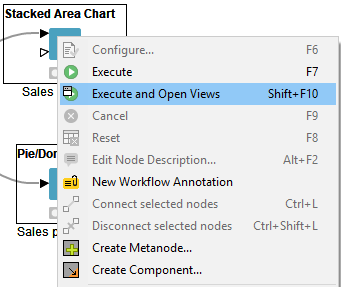 Figure 14. Executing and opening interactive view
 -
Or, once a node is executed, right click the node and select Interactive View: … instead, as shown in Figure 15
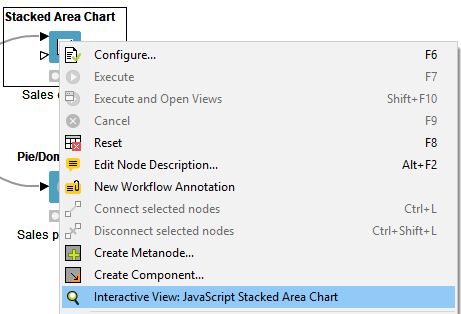 Figure 15. Opening interactive view of an executed node
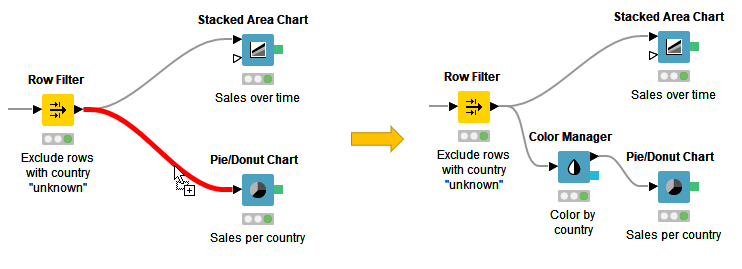
Currently, the pie chart uses default colors for different countries in the data. With the Color Manager node, you can assign the countries other colors than the default ones you see in Figure 5. The colors have to be assigned before building the graph, so you’ll have to add the Color Manager node in the middle of the workflow.
Add the Color Manager node:
-
By dragging the node from the node repository and releasing it on its place between the Row Filter node and the Pie Donut Chart node in the workflow when the connection has turned red, as shown in Figure 16. The red connection means that it’s ready to accept the new node when you release the mouse.
Example Workflows
Jump start your analysis with the example workflows on the KNIME Hub. You can either browse the example workflows directly on hub.knime.com or via the EXAMPLES mountpoint in the KNIME Explorer. You can copy the workflows to your local workspace, modify them according to your use case, or copy parts of them to your workflow. The workflows on the KNIME Hub are also a useful resource to learn about different use cases in KNIME Analytics Platform.
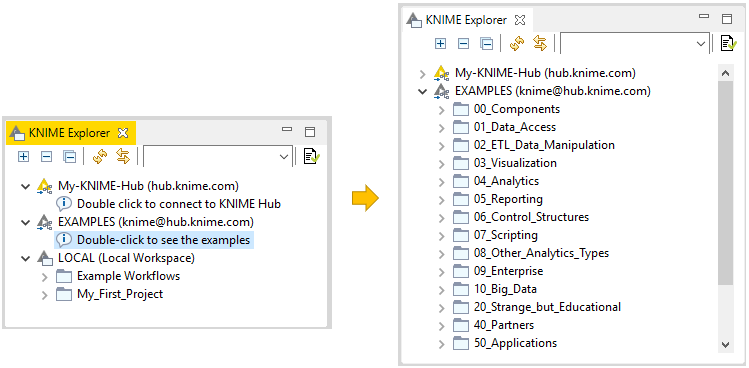
To access the example workflows from within KNIME Analytics Platform:
-
Expand the EXAMPLES mountpoint in the KNIME Explorer
-
Next, double click to see the example workflows ordered by categories, as shown in Figure 17. No credentials are necessary.
-
Inside these categories, some workflow groups are named after single operations, e.g. filtering
-
Other workflow groups have names that refer to broader topics, e.g. time series analysis
-
The "50_Applications" workflow group contains workflows that cover entire use cases like churn prediction or fraud detection
To download an example workflow:
-
Drag and drop
-
Or, copy and paste
the workflow into your LOCAL workspace. Double click the downloaded copy of the example workflow to open and edit it like any other workflow.
|
The video The EXAMPLES Server provides a more detailed introduction to the EXAMPLES server. |
Extensions and Integrations
If you want to add capabilities to KNIME Analytics Platform, you can install extensions and integrations. The available extensions range from free open source extensions and integrations provided by KNIME to free extensions contributed by the community and commercial extensions including novel technology nodes provided by our partners.
The KNIME extensions and integrations developed and maintained by KNIME contain deep learning algorithms provided by Keras, high performance machine learning provided by H2O, big data processing provided by Apache Spark, and scripting provided by Python and R, just to mention a few.
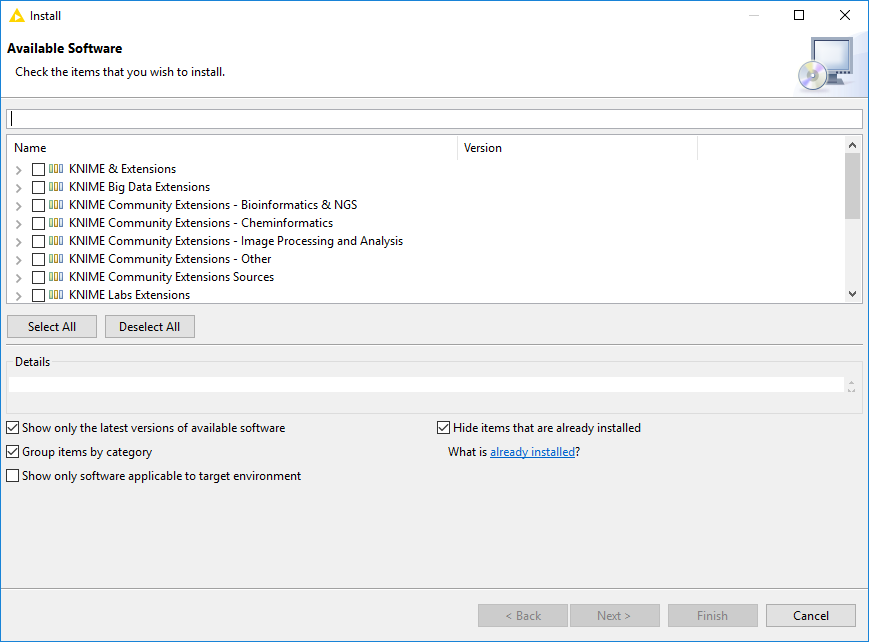
Install extensions by:
-
Clicking File on the menu bar and then Install KNIME Extensions…. The dialog shown in Figure 18 opens.
-
Selecting the extensions you want to install
-
Clicking "Next" and following the instructions
-
Restarting KNIME Analytics Platform
The KNIME extensions and trusted community extensions are available per default via an URL to their update sites. Other extensions can be installed by first adding their update sites.
To add an update site:
-
Navigate to "File" → "Preferences" → "Install/Update" → "Available Software Sites"
-
Click "Add…"
-
And either add a new update site by providing a URL via the "Location" field
-
Or, by providing a file path to a zip file that contains a local update site, via "Archive…"
-
Finally, give the update site some meaningful name and click "OK"
After this is done, the extensions can be installed as described further above.
| Update sites are explained in the Installation Guide in more detail. More information about extensions can be found in the Extensions and Integrations Guide. |
Update to the latest KNIME version by:
-
Clicking File and then Update KNIME… to make sure that you use the latest version of the KNIME Software and the installed extensions
-
In the window that opens, select the updates, accept the terms and conditions, wait until the update is finished, and restart KNIME Analytics Platform
Tips & Tricks
-
Get Help and Discuss at the KNIME Forum
Log in to our KNIME Community Forum, and join the discussions under different categories ranging from KNIME Analytics Platform, to extensions and integrations, special interest groups, and KNIME development. The forum is a lively community, where KNIME staff, along with other experienced KNIME users, are available to answer your questions. -
Import and Export Workflows
To import a workflow or a workflow group, right click anywhere in the local workspace in the KNIME Explorer and select Import (Export) KNIME Workflow…, as shown in Figure 19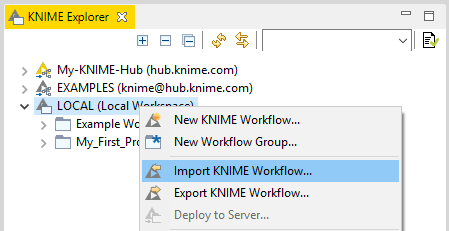 Figure 19. Importing and exporting workflows and workflow groups
Then, follow the steps explained below and shown in Figure 20:
-
To export a workflow or a workflow group first select the workflow (or group) you want to export
-
Next, write the path to the destination folder and the file name. If you export a workflow group, you can select the elements you want to export from inside the folder.
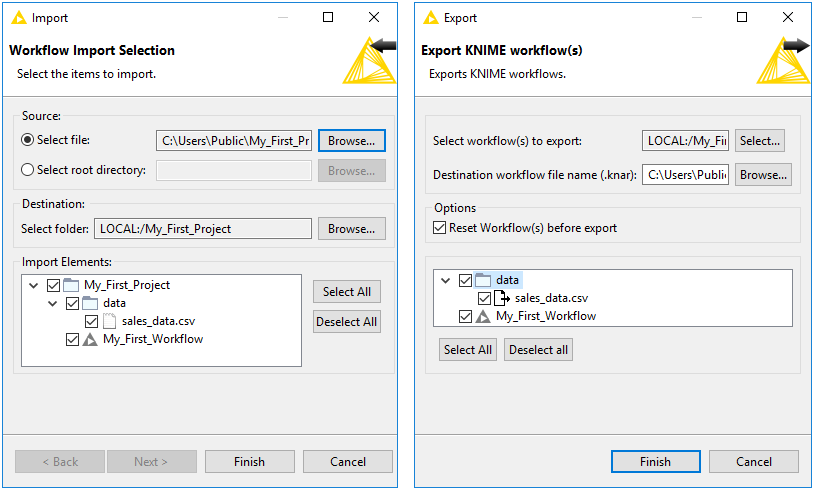 Figure 20. Defining path to a file to import or export
 -
-
Import Data by Dragging and Dropping a Data File
You can import a data file from the KNIME workspace or any location on your system by dragging and dropping it from the KNIME Explorer, Desktop or File Explorer to the workflow editor as shown in Figure 21. This method automatically creates the right node to read the file type, and it preconfigures the node by populating the file path setting with a file path URL relative to the KNIME Explorer location.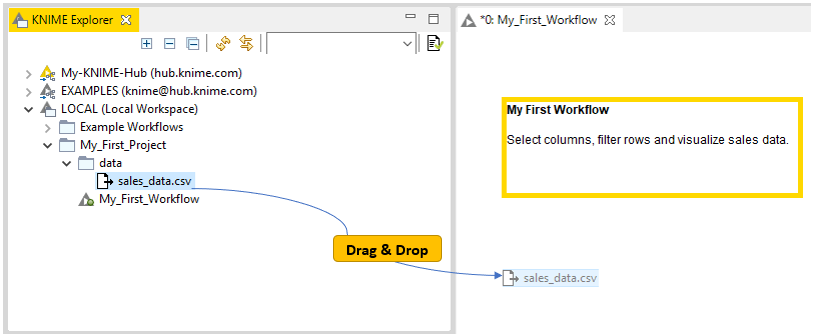 Figure 21. Reading data files by drag and drop
 -
Replace a Node in a Workflow
You can replace a node in your workflow by dragging a node from the repository and dropping it on top of an existing node as soon as a white arrow and boxes appear inside it as shown in Figure 22.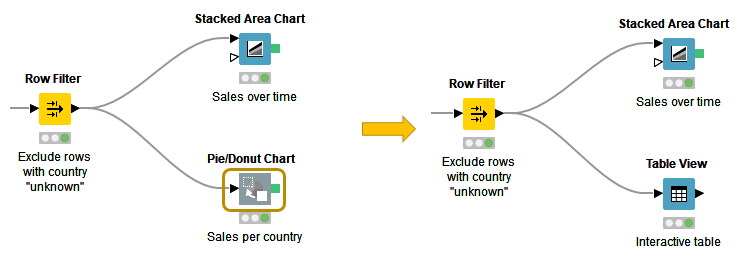 Figure 22. Replacing a node in a workflow
 -
Expand Your Node Search: Fuzzy Search and Crisp Search
If you are not sure of the name of the node you’re searching for, switch to fuzzy search mode in the node repository by clicking the icon next to the search field as shown in Figure 23. Your search results will now include any nodes related to the search term. In the crisp search mode, the search text must exactly match the node name itself. With more practice building workflows, you’ll remember more and more node names. After some time you’ll probably switch back to the crisp search mode to find the node you’re looking for faster.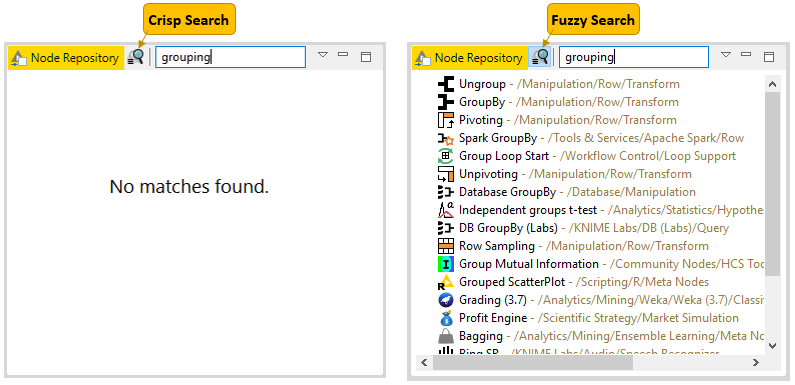 Figure 23. Crisp and fuzzy search mode
 -
Monitor the State of a Node
If you want to see the intermediate output tables in your workflow, you can add a Node Monitor panel to your KNIME Workbench:-
Click View → Other → KNIME Views → Node Monitor as shown in Figure 24
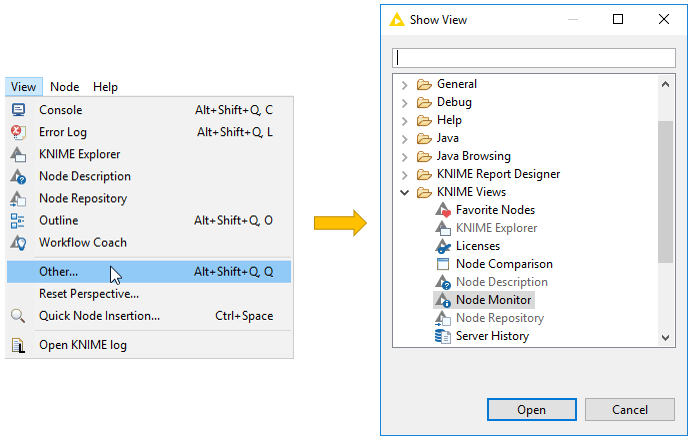 Figure 24. Adding a Node Monitor to the KNIME Workbench
 -
Next select Show Output Table in the View Menu in the upper right corner of the Node Monitor as shown in Figure 25. This panel now shows the output of the node you have selected in the workflow.
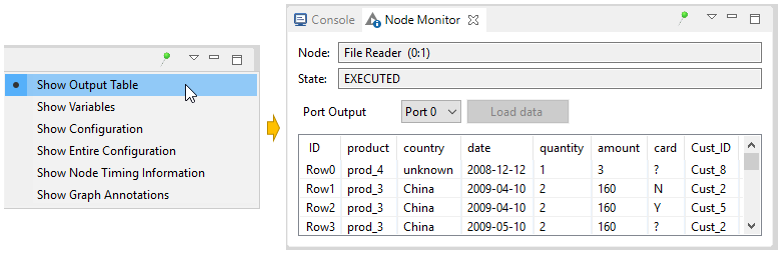 Figure 25. Showing output table in the node monitor
Besides the output table, you can also have the panel show the execution time of the node. You can also pin the output of one node. This means that the output of the currently selected node is shown independently of the selection in the workflow editor.
-