
User Guide
Introduction
This guide covers the basics of the KNIME Analytics Platform usage, guiding you in the first steps with the platform but also providing more advanced information about the most important concepts together with indication on how to configure the platform.
Workspaces
When you start KNIME Analytics Platform, the KNIME Analytics Platform launcher window appears and you are asked to define the KNIME workspace.
The KNIME workspace is a folder on the local computer to store KNIME workflows, node settings, and data produced by the workflow.
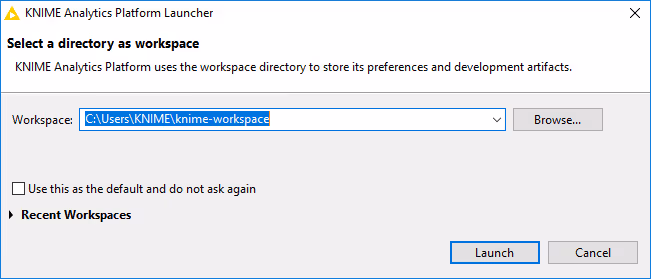
The workflows, components and data stored in the workspace are available through the space explorer in the side panel navigation.
You can switch the workspace in a later moment under Menu, in the top right corner of the user interface, and select Switch workspace.
User interface
After selecting a workspace for the current project, click Launch. The KNIME Analytics Platform user interface, the KNIME Workbench, opens.
The active workflow of the KNIME Analytics Platform will be displayed after switching from an opened workflow. If you have open multiple workflows before you switch the perspective, only the active workflow and all loaded workflow tabs of the current KNIME Analytics Platform will be displayed in the KNIME Modern UI.
For each workflow you will see a workflow tab after switching. After clicking the first tab (with the KNIME logo) you end up at the entry page:
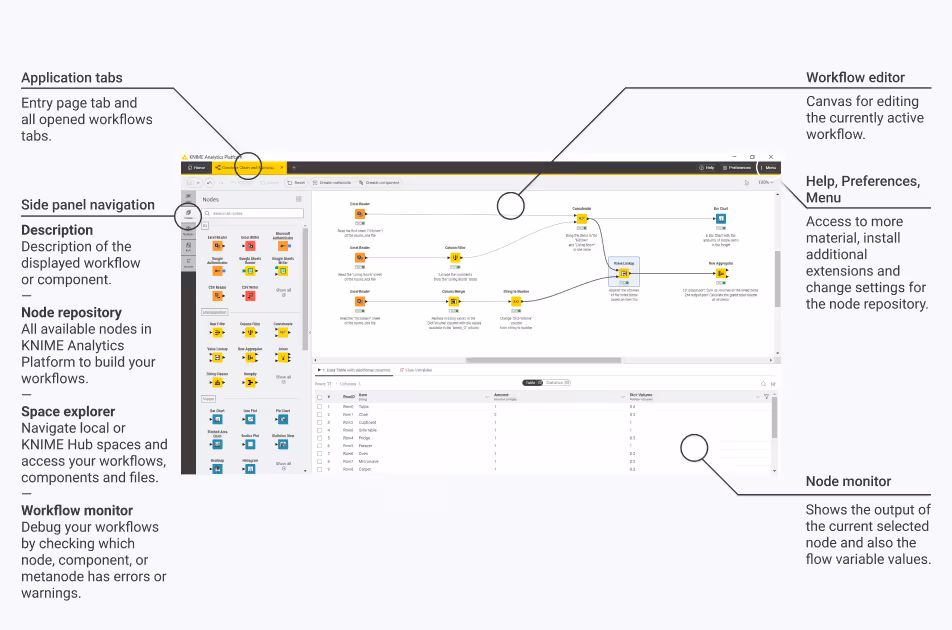
In the next few sections we explain the functionality of these components of the user interface:
- Entry page
- Workflow editor & nodes
- Connect to KNIME Hub
- Space explorer
- Node repository
- Node description
- Workflow description
- Node monitor
- Help menu
You can scale the interface by going to Menu > Interface scale.
Entry page
The entry page is displayed by clicking the Home tab.
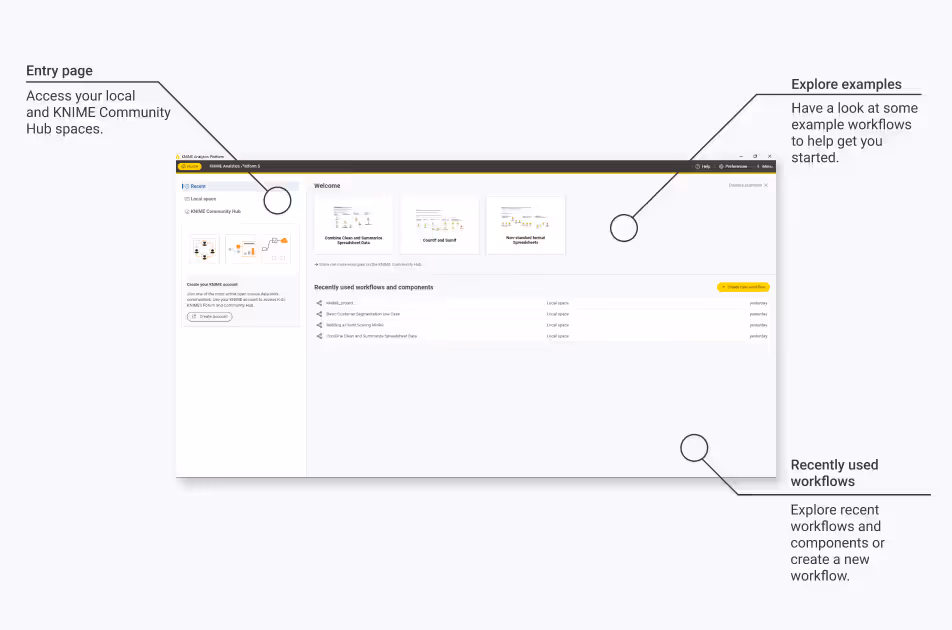
Here you will find:
Recent, Local space, KNIME Community Hub. By default only the local workspace, and the link to connect to your personal KNIME Community Hub space are visible. To add a new mount point follow the instructions in the Connect to KNIME Hub section. Select:
- Recent to see your recently opened workflows and components
- Local space to navigate the existing workflows in your local system
- KNIME Community Hub (or one of the available mount points). Click Sign in, provide your credentials and start navigating the available spaces.
Three example workflows to help you get started — You can dismiss the examples by clicking the button on the top right. To restore the examples click Help > Restore examples on home tab.
Create a new workflow by clicking the + button
Since KNIME Analytics Platform version 5.2 you can also add a KNIME Server mount point.
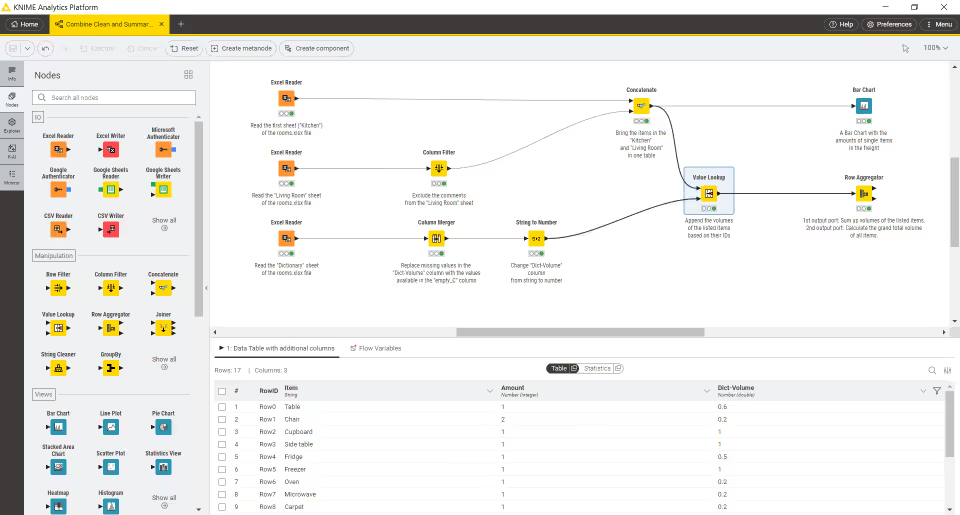
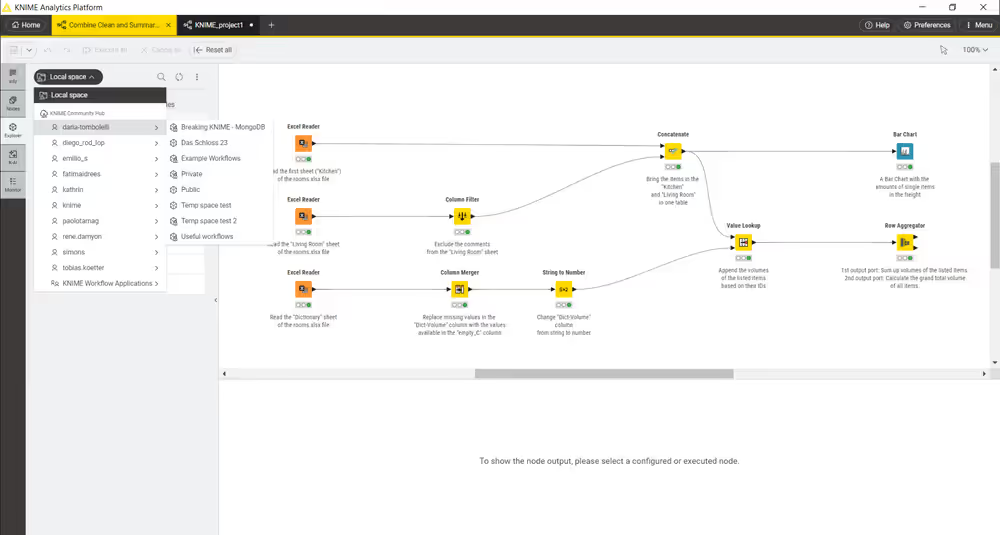
Workflow editor & nodes
The workflow editor is where workflows are assembled. Workflows are made up of individual tasks, represented by nodes.
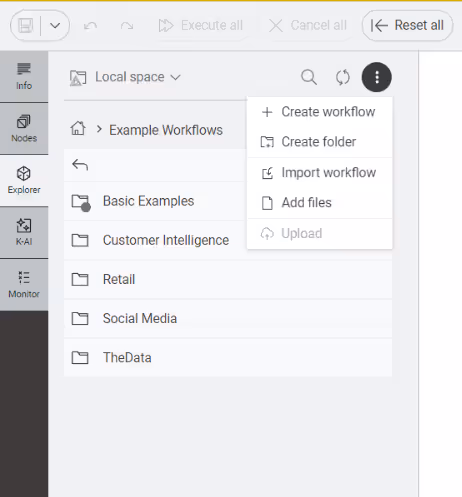
One way to create a new workflow is to go to the space explorer, click the three dots and select Create workflow from the menu. Give the workflow a name and click Create.
Once you have a workflow open you can always create a new workflow by clicking the + in the tabs bar at the top of the user interface.
In the new empty workflow editor, create a workflow by dragging nodes from the node repository to the workflow editor, then connecting, configuring, and executing them.
Nodes
In KNIME Analytics Platform, individual tasks are represented by nodes. Nodes can perform all sorts of tasks, including reading/writing files, transforming data, training models, creating visualizations, and so on.
Facts about nodes
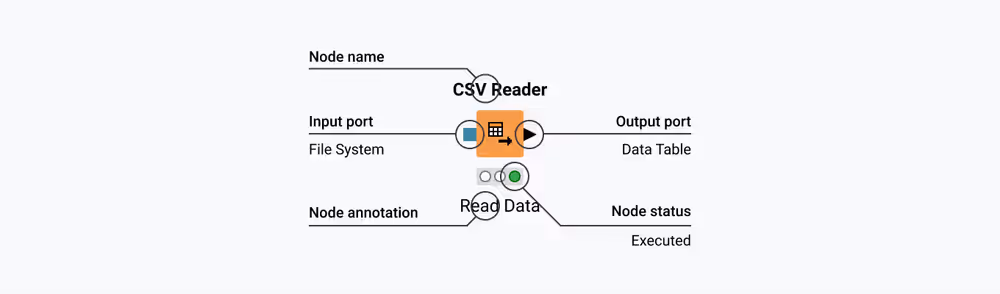
- Each node is displayed as a colored box with input and output ports, as well as a status
- The input port(s) hold the data that the node processes, and the output port(s) hold the resulting datasets of the operation
- The data is transferred over a connection from the output port of one to the input port of another node.
For simplicity we refer to data when we refer to node input and output ports, but nodes can also have input and output ports that hold a model, a database query, or another type explained in Node Ports.
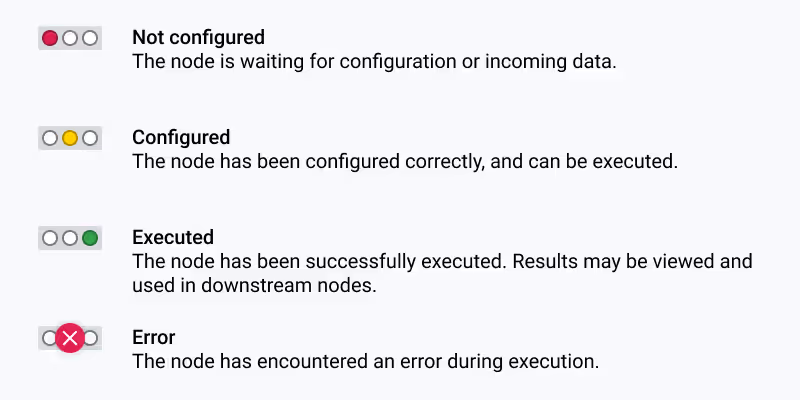
A node can be in different status:
Changing the status of a node
The status of a node can be changed, either configuring, executing, or resetting it.
All these options can be found:
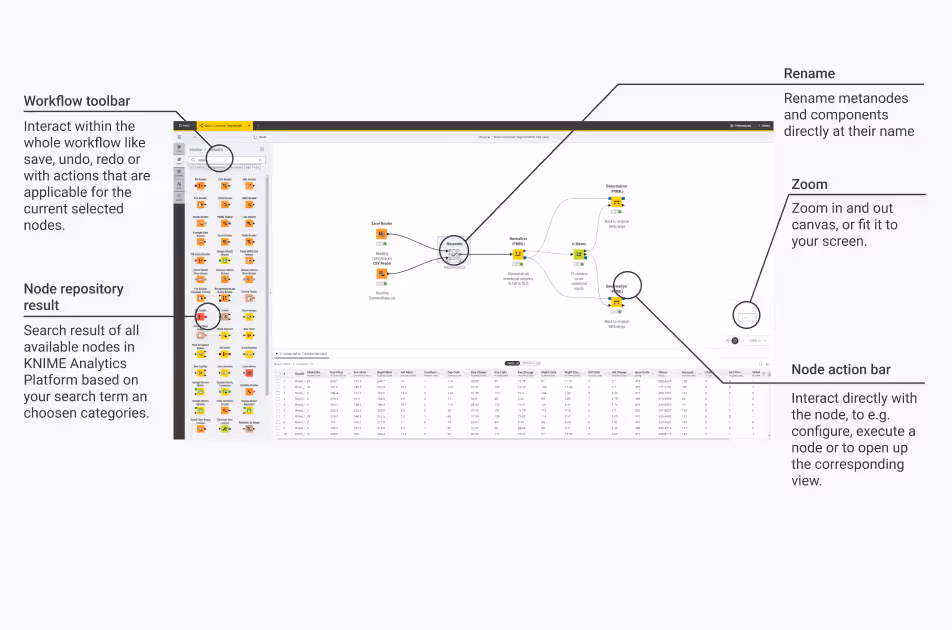
In the node action bar - click the different icons to configure, execute, cancel, reset and when available open the view.
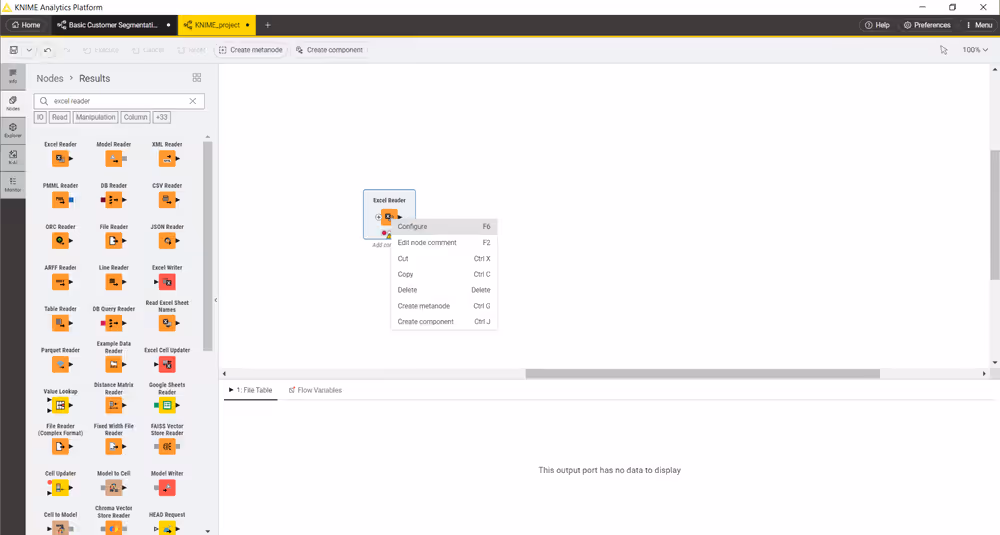
In the context menu of a node - open the context menu by right clicking a node.
Identifying the node status
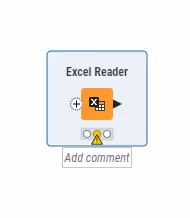
The traffic light below each node shows the status of the node. When a node is configured, the traffic light changes from red to yellow, i.e. from "not configured" to "configured".
When a new node is first added to the workflow editor, its status is "not configured", shown by the red traffic light below the node.
Configuring the node
The node can be configured by adjusting the settings in its configuration dialog.
To open the configuration dialog of a node, select the node and the configuration dialog will open automatically in the right panel of the user interface. If the configuration dialog is not supported in the right panel, click Open dialog to open the configuration dialog in a separate window.
You can set up your user interface to always open the configuration dialog in a separate window by going to Preferences in the top right corner of the user interface, then go to KNIME → KNIME Modern UI and select Open in new window under Node configuration dialog mode.
Executing the node
Some nodes have the status "configured" already when they are created. These nodes are executable without adjusting any of the default settings.
Execute a node by either:
- Clicking the Execute button in the node action bar
- Right clicking the node and selecting Execute
- Or, selecting the node and pressing F7
If execution is successful, the node status becomes "executed", which corresponds to a green traffic light. If the execution fails, an error sign will be shown on the traffic light, and the node settings and inputs will have to be adjusted as necessary.
Canceling execution of the node
To cancel the execution of a node click the Cancel button in the node action bar, or right click it and select Cancel or select it and press F9.
Resetting the node
To reset a node click the Reset button in the node action bar, or right click it and select Reset or select it and press F8.
Resetting a node also resets all of its subsequent nodes in the workflow. Now, the status of the node(s) turns from "executed" into "configured", the nodes' outputs are cleared.
Node ports
A node may have multiple input ports and multiple output ports. A collection of interconnected nodes, using the input ports on the left and output ports on the right, constitutes a workflow. The input ports consume the data from the output ports of the predecessor nodes, and the output ports provide data to the successor nodes in the workflow.
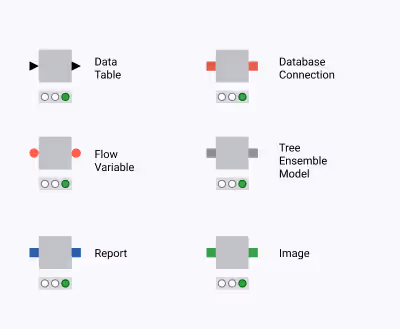
Besides data tables, input and output ports can provide other types of inputs and outputs. For each type the pair of input and output port looks different.
An output port can only be connected to an input port of the same type - data to data, model to model, and so on.
Some input ports can be empty, like the data input port of the Decision Tree View node. This means that the input is optional, and the node can be executed without the input. The mandatory inputs, shown by filled input ports, have to be provided to execute the node.
A tooltip gives a short explanation of the input and output ports. If the node is executed, the dimensions of the outcoming data are shown in its data output port. A more detailed explanation of the input and output ports is in the node description.
Adding nodes to the canvas
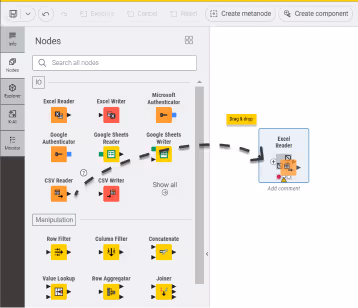
Currently, there are three ways of adding nodes to your canvas to build your workflow:
- Drag and drop a node from the node repository,
- double-click on a node inside the node repository, or
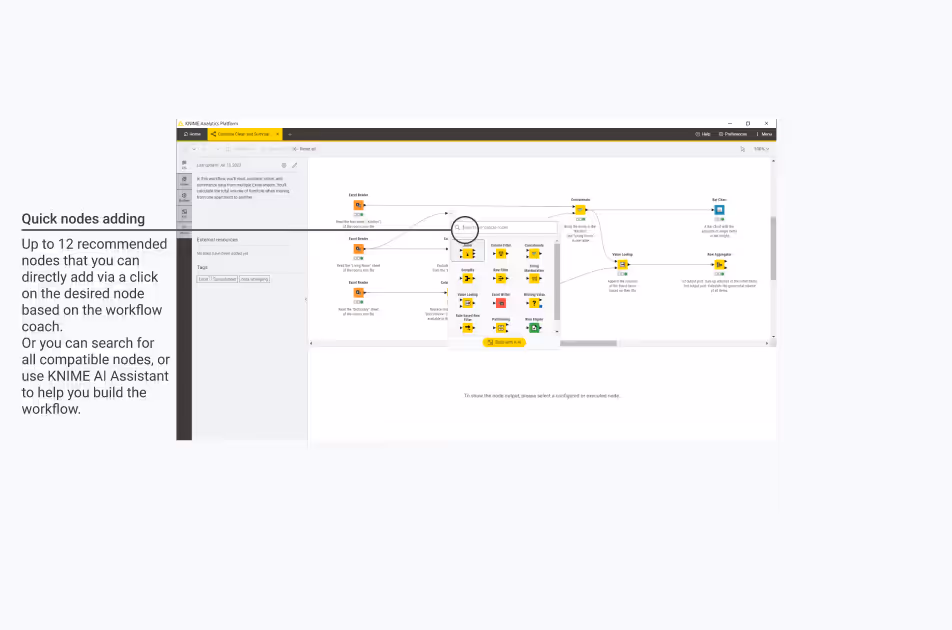
- via the quick nodes adding panel. Double click on the canvas or drag and drop a node port (input or output) into the canvas to open the quick node adding panel. This panel contains up to 12 recommended nodes or you can search in the panel for the desired node, then click the desired node to add it to the canvas.
To use quick nodes adding you need to allow us to receive anonymous usage data. This is possible at the startup of the KNIME Analytics Platform or after switching to a new workspace by selecting Yes in the “Help improve KNIME” dialog.
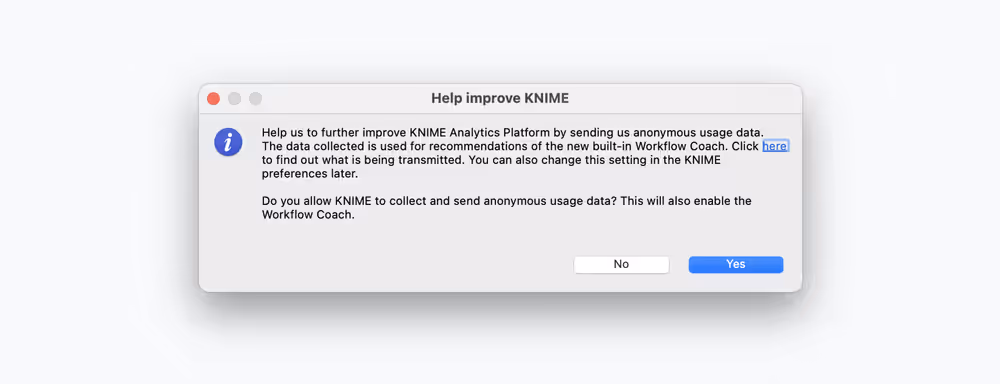
You can also activate it, via the Open Preference button that is displayed in the quick nodes adding panel.
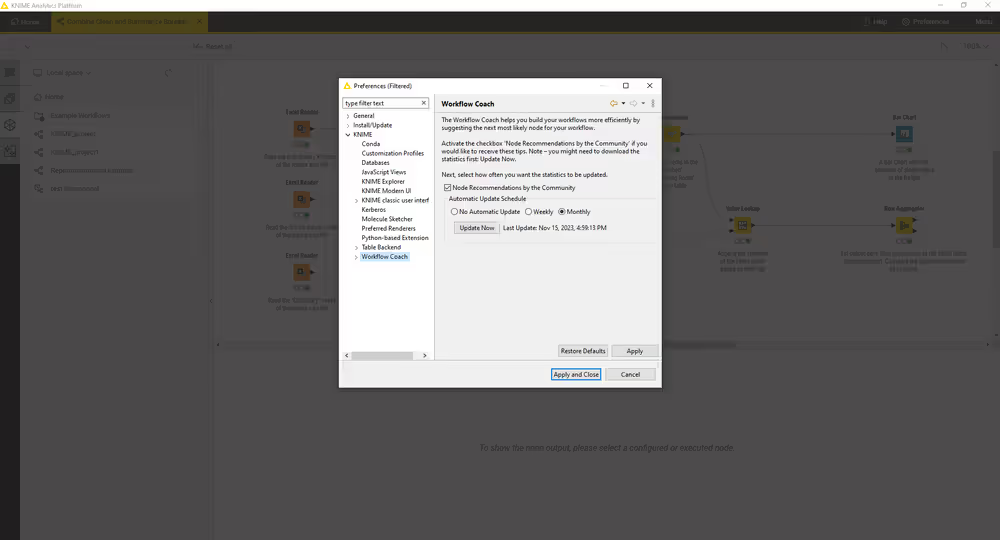
Click here to find out what is being transmitted. If you don’t want to do this anymore, you can deactivate it at any time in the KNIME Workflow Coach Preferences.
To open the preferences follow these steps:
- Click Preferences in the top right corner of the user interface
- Go to KNIME → Workflow Coach
- Deactivate the setting Node Recommendations by the Community
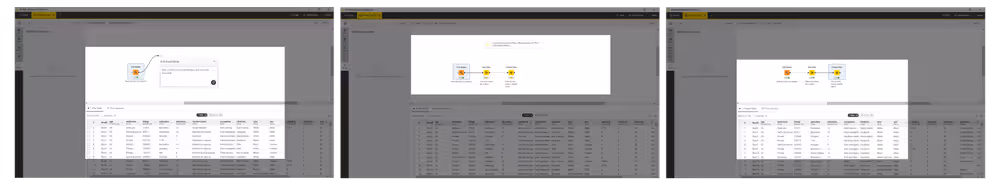
Finally, if you are logged in to the Hub to use the KNIME AI Assistant (K-AI), you will be able to use the Build mode of the AI Assistant directly in the quick nodes adding panel. Log into the KNIME AI Assistant with your KNIME Hub account and open the quick nodes adding panel. Here click Build with K-AI and you can add your prompt. K-AI will add nodes and relative comments to the canvas.
You can go back to the quick nodes adding panel default mode by clicking the ![]() icon.
icon.
How to select, move, copy, and replace nodes in a workflow
Nodes can be moved into the workflow editor by dragging and dropping them. To copy nodes between workflows, select the chosen nodes, right click the selection, and select Copy in the menu. In the destination workflow, right click the workflow editor, and select Paste in the menu.
To select a node in the workflow editor, click it once, and it will be surrounded by a border. To select multiple nodes, draw a rectangle over the nodes with the mouse.
Replace a node by dragging a new node onto an existing node. Now the existing node will be covered with a colored box with an arrow and boxes inside. Releasing the mouse replaces the node.
Comments and annotations
You have two options in the workflow editor to document a workflow:
Node label - Add a comment to an individual node by double clicking the text field below the node and editing the text
Workflow annotation - Add a general comment to the workflow, right click the workflow editor and select New workflow annotation in the menu. Now a text box will appear in the workflow editor.
Enter Annotation mode by clicking the
 icon (top-right) or pressing
 T.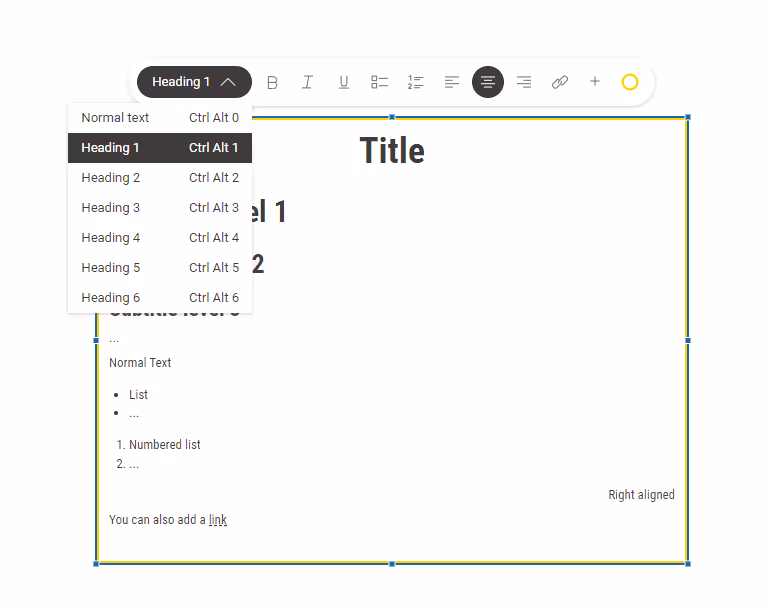
Double click the workflow annotation to add text and format the text and change the color of the annotation outline. To change the format you can use the annotation bar or use the following syntax:
To create a heading, add number signs (
#), followed by a space, in front of a word or phrase. The number of number signs you use should correspond to the heading level (<h1>to<h6>).To create a bullet list, add a star sign (
*) followed by a space.To create a numbered list, add a number followed by a point (
1.), followed by a space.To make a text bold, italic, or underlined, select the text and press
CTRL+b,CTRL+i,CTRL+u.Finally you can click outside the annotation and click the annotation once again to move it around the canvas or to change its dimensions.
Connect to KNIME Hub
By default you can connect to your account on KNIME Community Hub from the Home tab.
It is possible to add a new KNIME Hub instance by clicking Preferences, in the top right corner of the user interface.
Go to KNIME Explorer section and click New…. In the window that opens select KNIME Hub and add your Hub URL. Then click Apply.
Now the new KNIME Hub will show up in the Home tab.
Sign in and select the space you want to work on. The content of the space and the related operations you can do on the items are visible in the space explorer.
Switch back to KNIME classic user interface
You can switch back to the classic KNIME Analytics Platform user interface under Menu, in the top right corner of the user interface, and select Switch to classic user interface.
You can switch back to KNIME Modern UI at any time by pressing the button Open KNIME Modern UI in the classic user interface, at the top right corner.
Really, really, really important disclaimer
Workflow elements such as connectors or annotations are visualized in a new way and may not look exactly like in the current KNIME Analytics Platform. Changes will therefore not look 100% the same.
Space explorer
The space explorer is where you can manage workflows, folders, components and files in a space, either local or remote on a KNIME Hub instance.
A space can be:
- Your local workspace you selected at the start up of the KNIME Analytics Platform
- One of your user’s spaces on KNIME Community Hub
- One of your team’s spaces on KNIME Business Hub
You can switch to other spaces by:
Going to the Home tab and selecting one of the available spaces.
Here you can filter the space by clicking the icon
icon 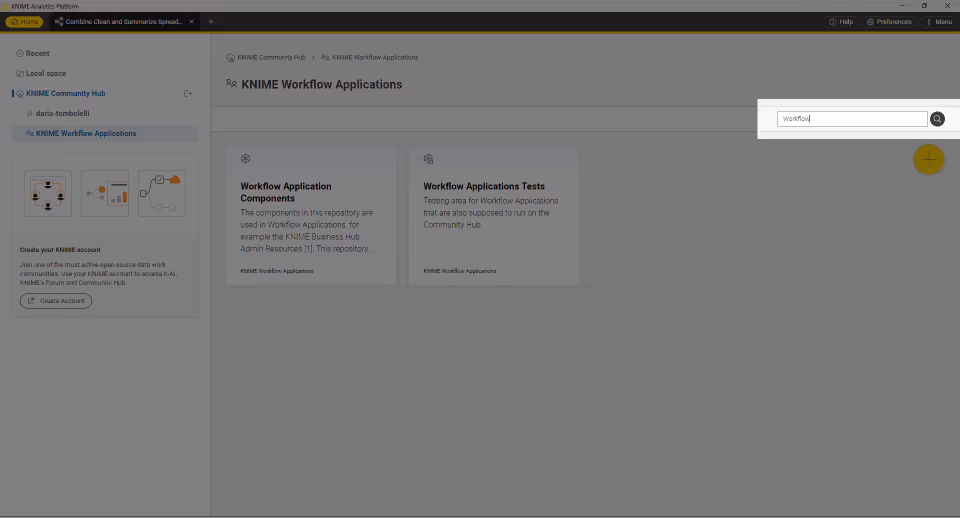
On the top of the space explorer you can sign in to any of the Hub or Server mount points and select a space. You will see the spaces grouped by owner when on KNIME Hub.
If you have a workflow open right-click the workflow tab at the top and select Reveal in space explorer to locate the workflow in the space explorer.
In the space explorer you can see:
- Workflows
- Folders
- Data files
- Components
- Metanodes
Double click a workflow to open it in the workflow canvas and start adding nodes to the canvas from the node repository.
- An overview on components and metanodes is available in the KNIME Components Guide.
Here you can click the three dots to select one of the following actions within the current space:
- Create a new folder or a new workflow
- Import a workflow
- Add a file
You can also drop files to the canvas. KNIME will create the appropriate file reading node automatically and preconfigure it. Finally you can drop a component to the canvas to use the component in the current workflow.
Select an item from the current space and right click on it to access the item context menu.
If your in your local space, you will have the following options:
- Rename
- Delete
- Duplicate
- Export (only available for workflows)
- Upload (if you are already connected to one of the available Hub mount points)
- Connect (to connect to the available Hub mount points without leaving the current view)
If you are navigating through a space in your KNIME Hub, you will have the following options:
- Rename
- Delete
- Duplicate
- Download
- Move to…
- Copy to… (only available for workflows and components)
- Open in Hub.. (only available for workflows and components)
Open workflows from KNIME Hub
Another possibility you have to open a workflow that exists on you KNIME Hub in the Analytics Platform is to drag and drop the workflow from the Hub in the browser.
To do so go to the Hub instance (e.g. your KNIME Business Hub instance or KNIME Community Hub) sign in with your account and navigate to the workflow you want to open.
Here you can drag and drop the workflow drag & drop element or the URL to the Analytics Platform and the workflow will open.
You can select a specific version of your workflow to view and interact with it in the Analytics Platform. If you do not select a specific version you will view and interact with the workflow in the current state.
Building workflows
When you create a new workflow, the canvas will be empty.
To build the workflow you will need to add nodes to it by dragging them from the node repository and connecting them. Alternatively you can drag an output port of a node to show the workflow coach which will suggest you the compatible nodes and directly connect them.
Once two nodes are added to the workflow editor, they can be connected by clicking the output port of the first node and release the mouse at the input port of the second node. Now, the nodes are connected. For some nodes you might have the ability to add specific ports. When hovering over these nodes you will see a + sign appearing. Click it to add a port. If the nodes supports different types of these dynamic ports a list will appear for you to scroll down to select the type of port you want to add.
You can also add a node between two nodes in a workflow. To do so drag the node from the node repository, and release it at its place in the workflow.
Versioning workflows
When uploading workflows to a space on KNIME Hub, you will be able to keep track of their changes. Your workflow will be saved as a draft until a version is created.
When you create versions of the workflow, you can then go back to a specific saved version at any point in time in the future to work with the workflow in that specific version.
Once a version is created, new changes will show up as draft.
Create a version
To create a version of the workflow:
Open the workflow you want to create a version of.
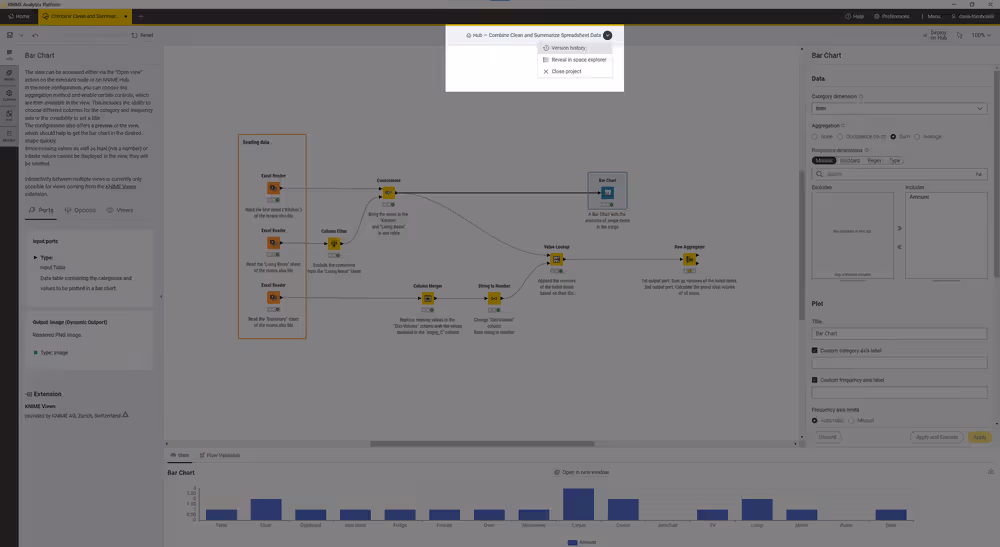
Click the
 icon beside the name of the workflow in the top of the interface.
Select Version history from the dropdown menu.
In the Version history dialog, click the Create version button.
In the Create version dialog, enter a name and a description for the version.
Click the Create button to create the version.
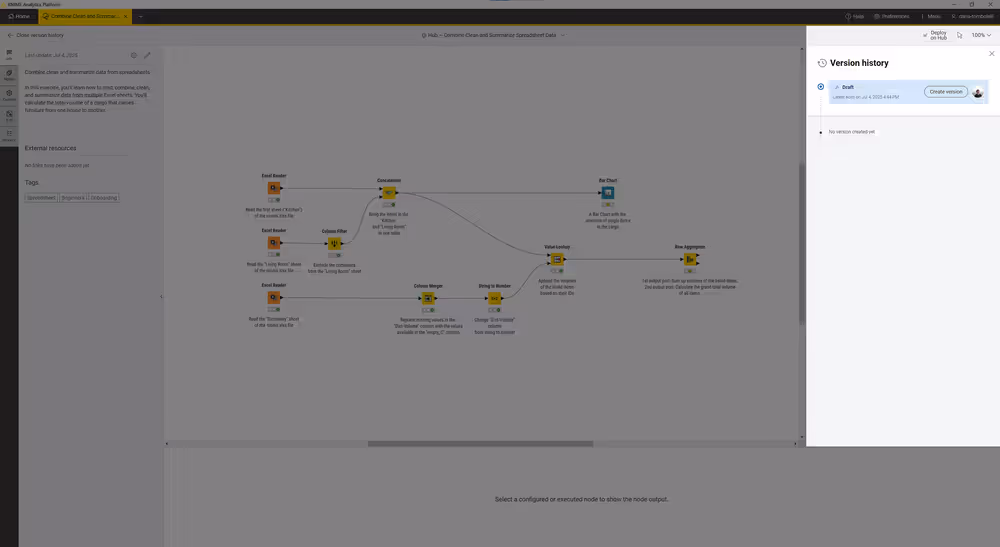
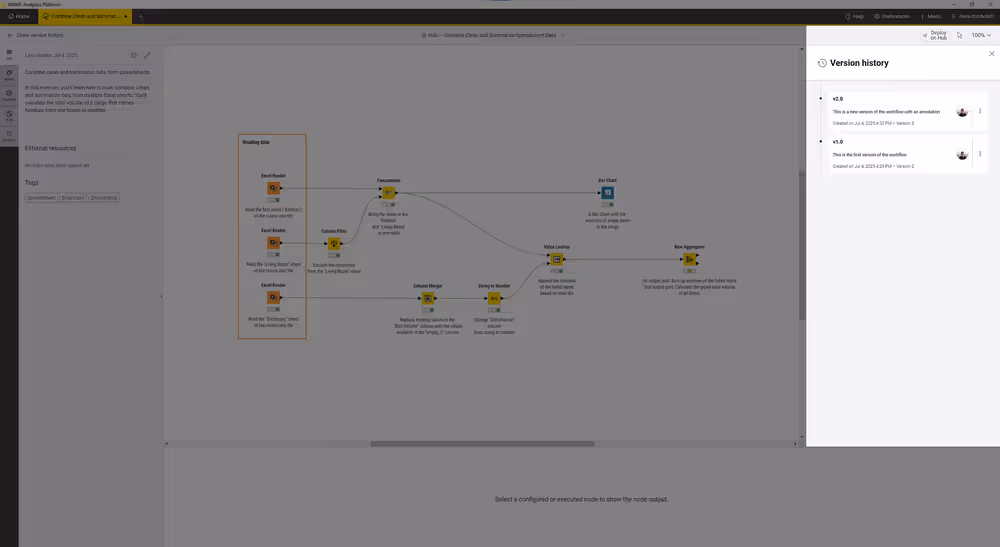
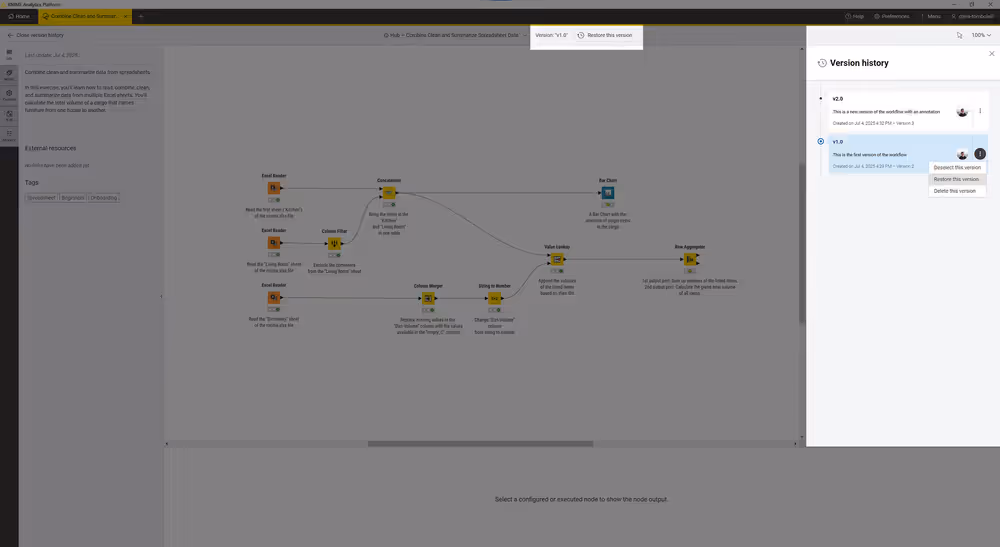
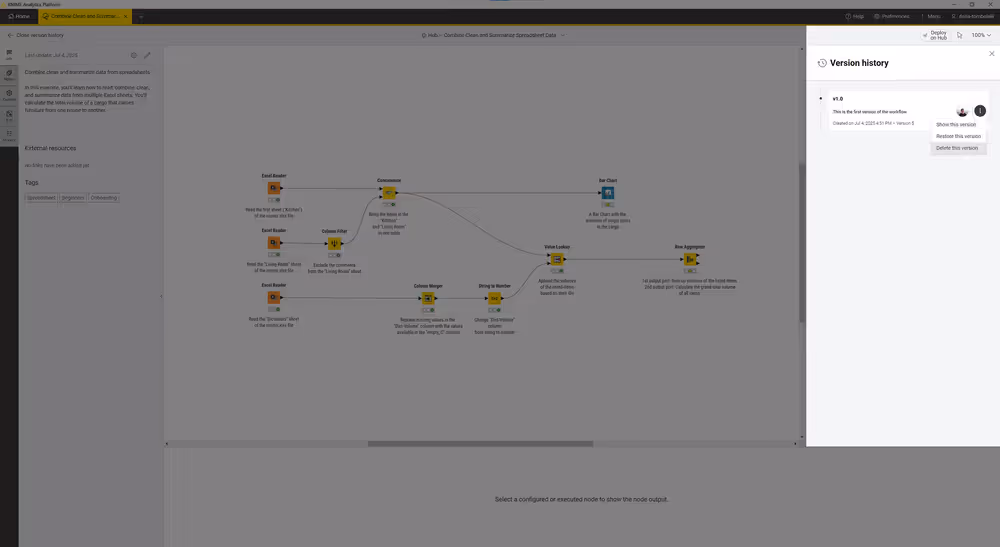
View version history
In the Version history dialog you can see all the versions of the workflow, including the draft version. You can see the name, description, creation date of each version and the user who created it.
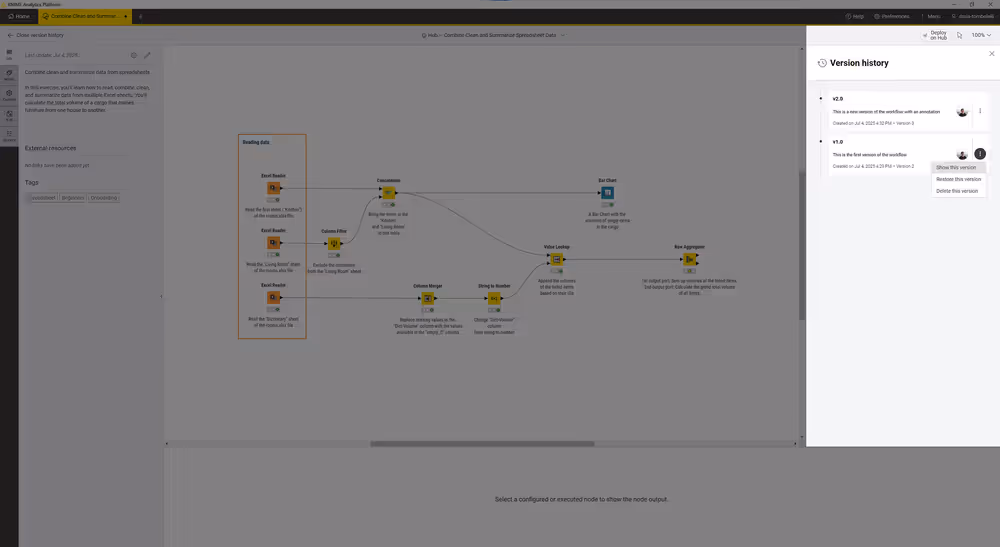
Show a version
To show a specific version of the workflow you can
Click the
%20scale(3)'%20/%3e%3cline%20x1='0'%20y1='0'%20x2='0'%20y2='0'%20transform='translate(16,%2016)%20scale(3)'%20/%3e%3cline%20x1='0'%20y1='0'%20x2='0'%20y2='0'%20transform='translate(16,%2024)%20scale(3)'%20/%3e%3c/svg%3e) icon beside the version you want to show and select Show this version from the dropdown menu.
icon beside the version you want to show and select Show this version from the dropdown menu.Click the version tile in the version history dialog.
The workflow in this version will be opened in the workflow canvas and you can work with it as usual.
In the version history dialog the version you are currently viewing will be selected and shown in blu.
To select or deselect the version you can:
- Click the icon beside the version you want to deselect and select Deselect this version from the dropdown menu.
- Click the selected version tile in the version history dialog.
Restore a version
To restore a version of the workflow you can:
- Click the icon beside the version you want to restore and select Restore this version from the dropdown menu.
- Click the Restore this version button beside the name of the workflow in the top of the interface.
Since restoring a version will overwrite the current workflow and unversioned changes will be lost, you will be asked to confirm the action in the Confirm version restor dialog.
Once you Confirm the version will be restored as a draft.
Delete a version
To delete a version of the workflow you can click the ![]() icon beside the version you want to delete and select Delete this version from the dropdown menu.
icon beside the version you want to delete and select Delete this version from the dropdown menu.
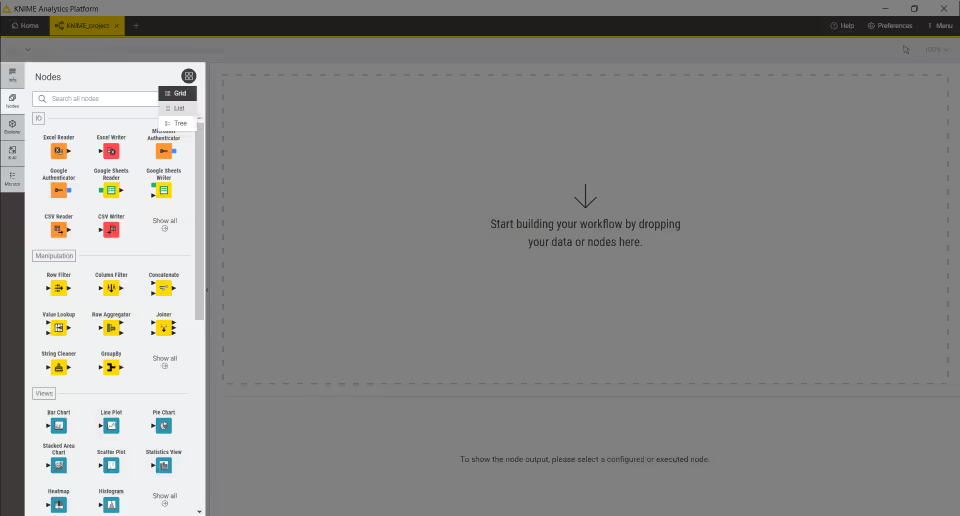
Node repository
Currently installed nodes are available in the node repository. You can add a node from the node repository into the workflow editor by drag and drop it into the workflow canvas, as explained in the section Building Workflows.
Search for a node by typing a search term in the search field on top of the node repository.
You can view the node repository as Grid, List, or Tree. Switch between these views by clicking the corresponding icon in the repository header: ![]() (Grid view),
(Grid view), ![]() (List view), or
(List view), or ![]() (Tree view).
(Tree view).
Node description
You can access the node description, with information about the node function, the node configuration and the different ports available for the node in the following ways:
- Select a node you added in the canvas, go to the side panel navigation and select the first option
- Hover over a node in the node repository and click the info icon that appears. This will open the node description panel.
Workflow description
The description panel on the left of the KNIME Analytics Platform provides a description of the currently active workflow, or a selected component.
Click the pen icon to change the workflow description, add links to external resources and add tags.
Double click the workflow annotation to add text and format the text and change the color of the annotation outline. To change the format of the description you can use the formatting bar or use the following syntax:
- To create a bullet list, add a star sign (
*) followed by a space. - To create a numbered list, add a number followed by a point (
1.), followed by a space. - To make a text bold, italic, or underlined, select the text and press CTRL+b, CTRL+i, CTRL+u.
To change a component description you need to first open the component. To do so, select the component, right-click and select Component > Open component from the context menu.
KNIME AI Assistant
KNIME features an AI assistant designed to efficiently answer your queries about the KNIME platform and assist in building customized workflows, simplifying your data analysis tasks.
If you can not find the AI Assistant side panel, the AI Assistant might be deactivated by your administrator.
How K-AI Handles Your Data
To power our AI features, KNIME connects to providers like OpenAI or Microsoft Azure. Here is exactly what gets shared:
- Your Chats: Anything you type into the AI Assistant is sent to the provider to generate a response.
- Workflow Metadata: In Build mode, K-AI automatically sees your column names and data types. This allows it to suggest relevant logic and configurations for your specific nodes.
- Actual Data (Optional): K-AI cannot see your actual data values unless you explicitly toggle the "Fetch Data" permission. This is off by default and used only to provide highly specific troubleshooting or analysis.
Build mode permissions
For details on how to manage these permissions and when data is accessed, see the Build mode section.
Models used
K-AI relies on two OpenAI models:
- Q&A mode — powered by GPT-4.1-mini
- Build mode — powered by GPT-4.1
K-AI is not hosted by KNIME. Instead, it connects directly to the OpenAI API, which processes the requests and sends back responses. For more information, see the OpenAI Platform Privacy Policy.
KNIME Community Hub
K-AI is available to all users signed in with a KNIME Community Hub account.
In this setup:
The general-purpose model provider is fixed to OpenAI and cannot be changed.
Each time you launch K-AI, a disclaimer is shown explaining what information will be shared with OpenAI:
- Any text you enter in the chat.
- Certain workflow metadata (e.g., column names and data types in Build mode).
You must explicitly accept this disclaimer to proceed.
If you decline, K-AI remains disabled.
Community Hub access levels:
K-AI availability and usage are tied to your Community Hub account level.
Free users – 20 AI interactions per month (resets monthly)
Paid users (KNIME Pro and KNIME Team) – 500 AI interactions per month, €0.025 per 5 additional requests after the monthly limit (resets monthly)
KNIME Business Hub
For KNIME Business Hub customers, K-AI and related AI features are highly configurable:
- Organizations must select and configure their own model provider, such as Azure OpenAI, and supply the required credentials.
Without this configuration, K-AI cannot be enabled. - Admins can customize the user disclaimer shown before K-AI is used.
- KNIME does not host or provide models by default — all hosting and access control remain fully under the customer’s management.
For configuration details, see the KNIME Business Hub Advanced Admin Guide.
Related AI features
K-AI is one part of KNIME’s broader AI ecosystem. Other features include:
- AI Extension
Provides nodes to connect to external providers (e.g., OpenAI, Google, Anthropic). Users supply their own credentials, and KNIME only provides the building blocks for workflows.
For more information, see the KNIME AI Extension Guide. - GenAI Gateway (Enterprise only)
Lets admins register models from various providers and securely route requests between KNIME Analytics Platform users and those providers. KNIME does not include any models by default — all models must be added and managed by the customer.
For more information, see the KNIME Business Hub Admin Guide.
Usage
To access the AI assistant, please log in to KNIME Hub.
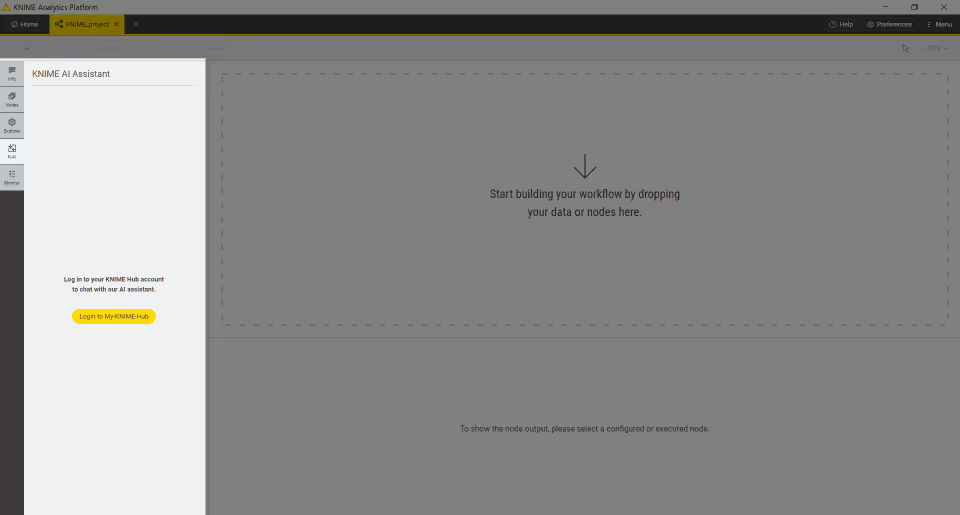
If you have access to a KNIME Business Hub instance that is equipped with AI assistant support, you can select the specific instance to use via the AI Assistant preferences page and then log in via the AI assistant side panel.
To use the AI assistant, it is mandatory to first accept the terms outlined in the disclaimer.
The KNIME AI Assistant offers two modes:
- A Q&A mode, and
- A Build mode.
These can be selected using the toggle button located at the top of the side panel.
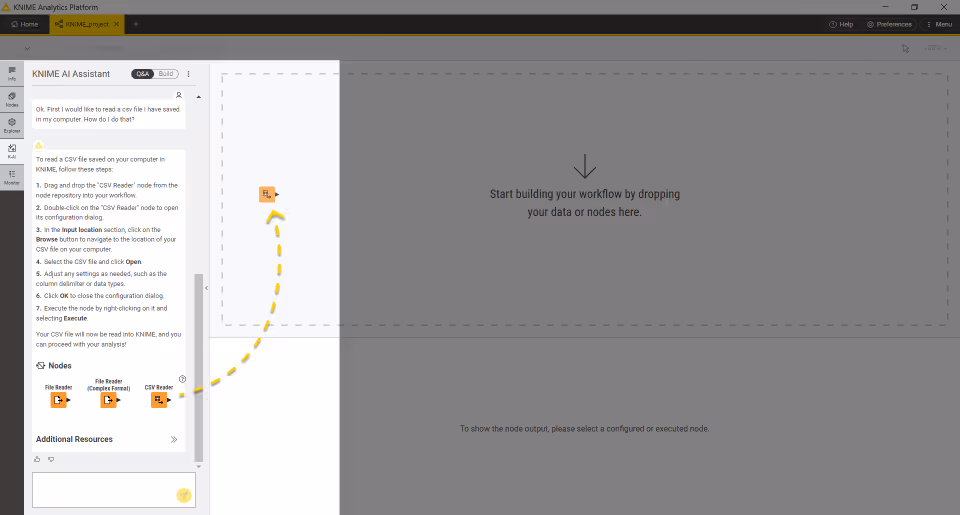
Q&A mode
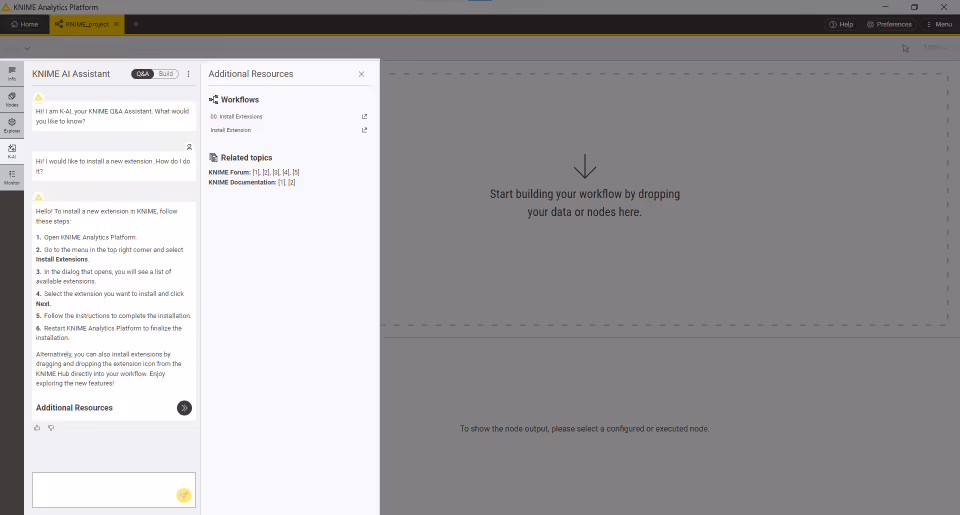
In the Q&A mode, you can inquire about KNIME functionalities, including how to execute specific tasks, and receive informative answers.
These answers may feature recommendations for nodes effective in achieving the tasks at hand. If the suggested nodes are already installed, they can be directly dragged into the workflow. For nodes not yet installed, a link to the KNIME Hub is provided. You can then install these nodes via drag-and-drop from KNIME Hub.
By clicking the question mark located at the top of the answer, you will be provided with links to the sources that were used to generate the response.
Click the ![]() icon to check Additional Resources like workflows, forum posts, and KNIME Documentation.
icon to check Additional Resources like workflows, forum posts, and KNIME Documentation.
You can leave feedback if the answer was useful to you by hovering over the answer and clicking the thumbs up or thumbs down icons that appear.
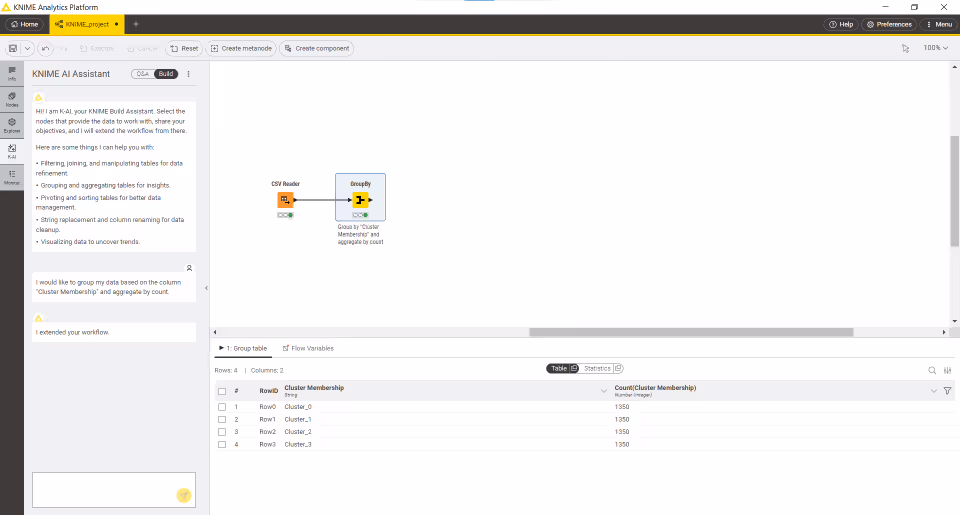
Build mode
Build mode is designed to extend your workflows based on your queries. By selecting an existing node that provides data, K-AI can dynamically expand your workflow from that point. Please note that while we are expanding compatibility to more nodes, some are not yet supported.
You can also use Build mode directly on the workflow canvas. To do so, open the quick nodes adding panel by dragging a connection from an existing node's output port. Select Build with K-AI and enter your prompt.
Data fetch permissions in Build mode
In Build mode, K-AI automatically has access to column names and data types. To provide more accurate assistance, K-AI can also access your actual workflow data, but this requires your explicit permission.
When K-AI needs to fetch data, a permission dialog will appear:
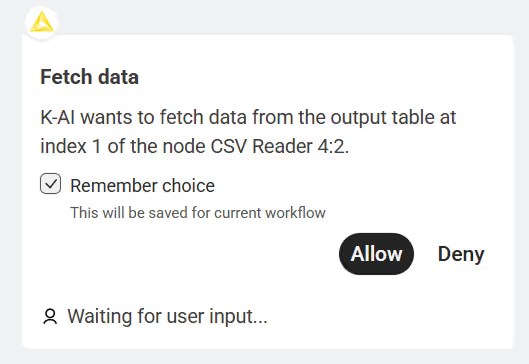
- Permission is workflow-specific: You must grant permission separately for every workflow where you want K-AI to fetch data.
- "Remember choice": If you select this, your preference is saved only for the current workflow, not globally.
- Resetting permissions: To change a remembered decision, click the Three Dots Menu () in the K-AI panel and select Reset permissions for this workflow.
Once permission is granted, K-AI provides tailored suggestions based on your actual data values:
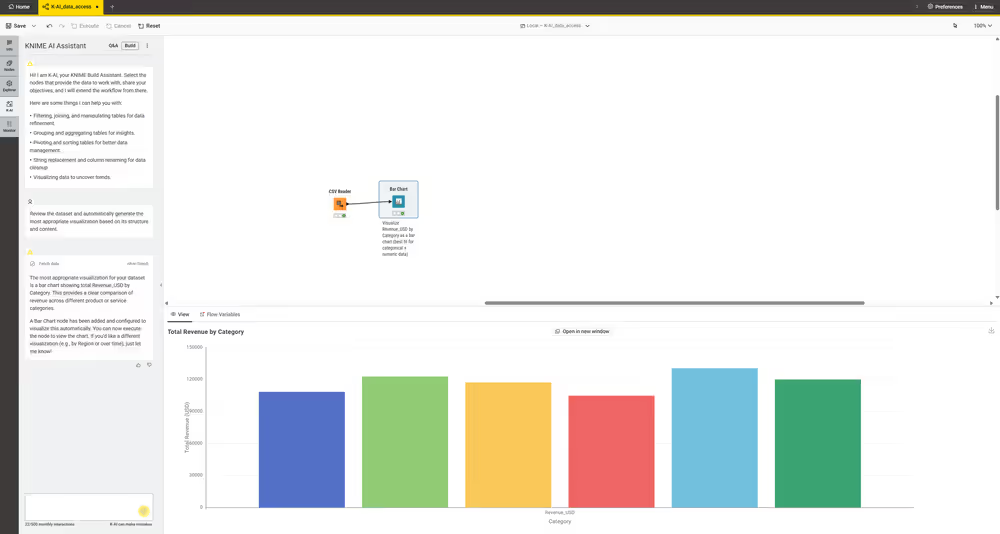
INFO
If you do not grant this permission, K-AI will still assist you using metadata (column names and types) but will not be able to see your actual data records.
Node execution permissions in Build mode
K-AI can execute nodes directly to help you see results faster. For example, after building a sequence, you can ask K-AI to run specific nodes to generate output.
Before any execution occurs, K-AI will prompt you for permission:
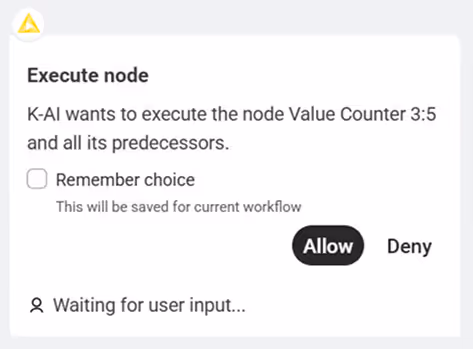
- Allow: Grants permission to run the selected node and all nodes leading up to it (predecessors) to ensure results are generated.
- Deny: Refuses execution. K-AI will not run the node.
- Persistent Choices: If you select "Remember choice," your decision applies to the entire current workflow, and you will not be prompted again for this workflow.
- Resetting Permissions: To change a remembered setting, click the Three Dots Menu () in the K-AI panel and select Reset permissions for this workflow.
Deactivation
If you want to deactivate the AI assistant and hide it from the side panel, follow these steps:
Using Preferences:
- Go to Preferences > KNIME Modern UI > AI Assistant.
- Uncheck the option Enable the KNIME AI Assistant.
Using the
knime.inifile:Open the
knime.inifile.Add the following entry:
ini-Dorg.knime.ui.feature.ai_assistant=falseThe setting in the
knime.inifile will always override the setting in the Preferences.
Additional Information:
The AI Assistant might also be deactivated via customization profiles. However, the setting in the knime.ini file will always take precedence over the customization profile.
The AI Assistant status setting will have the following prioritization:
knime.inifile- Customization profile
- Preferences
Workflow monitor
Access the workflow monitor tab from the side panel navigation of the user interface. Here, you can find errors and warnings that might arise from the execution of your workflow.
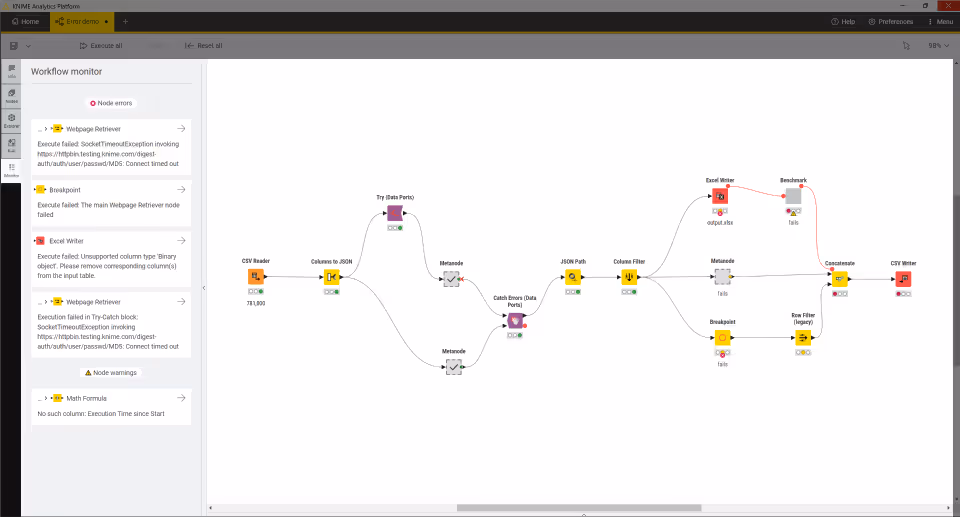
When a node error or a node warning occurs you can click the ![]() icon to select the node that is causing the issue in the workflow.
icon to select the node that is causing the issue in the workflow.
If the node is in a component or a metanode this will automatically navigate to the level where the node that is causing the issue is present.
Node monitor
The node monitor tab is located on the bottom part of the user interface. It is especially useful to inspect intermediate output tables in the workflow.
Here you can choose to show the flow variables or a preview of the output data at any port of a selected node in the active workflow.
Switch to Statistics in order to see some basic statistics of the data.
You can also detach the table or the statistics view and open it in a new window. To do so click the ![]() icon in the respective view (Table or Statistics). This allows you to open multiple table or statistics for multiple nodes in your workflow.
icon in the respective view (Table or Statistics). This allows you to open multiple table or statistics for multiple nodes in your workflow.
Read more about the data table shown in the node monitor in the KNIME tables section.
Help
By clicking the Help button in the top right corner of the user interface you can see multiple useful links like:
- Keyboard shortcuts to speed up your workflow building process without relying on a computer mouse.
- Some learning resources like cheat sheets, getting started guide and documentation
- The KNIME Forum to ask the community about workflow building, tips and tricks
- About page for KNIME Analytics Platform - also with currently installed version and access to Installation Details
- Additional credits about open source software components
Managing workflow states and logs
Node reset and workflow execution
When a node is reset, the node status changes from "executed" to "configured," and the output of the node is no longer available. When saving a workflow in an executed state, the data used in the workflow is saved as well. This means that larger datasets result in larger file sizes. Therefore, it is recommended to reset workflows before saving them if the dataset can be accessed without any restrictions. A reset workflow only saves the node configurations, not the results.
KNIME log and node operations
Resetting a node does not undo the operation executed before. All operations done during creation, configuration, and execution of a workflow are reported in the KNIME log.
The KNIME log is a file called knime.log, which can be found via Menu > Show KNIME log in File Explorer. In the KNIME classic user interface, it is accessible via View > Open KNIME log. The file is saved on disk under the path <knime-workspace>/.metadata/knime/knime.log.
Logging
In addition to the global knime.log file, KNIME Analytics Platform writes log messages to several other targets. Three of these targets are not files; instead, they stream their output to a terminal or console (a so-called tty target).
Each log file can grow only up to a configurable limit. When that limit is reached, the log file is rotated by starting a fresh file and compressing the previous one into a numbered archive in the same directory. This keeps logs manageable and prevents your disk from filling up.
| Log target | Location | Purpose | Default max. size | Log level preference |
|---|---|---|---|---|
KNIME log (knime.log file) | <knime-workspace>/.metadata/knime/knime.log | Messages from KNIME Analytics Platform and every node, including workflow events. | 10 MB (configurable via -Dknime.logfile.maxsize=<size>) | logging.loglevel.logfile |
Per-workflow logs (knime.log file) | <knime-workflow>/knime.log | Messages that belong only to the corresponding workflow. | 10 MB (configurable via -Dknime.logfile.maxsize=<size>) | logging.loglevel.logfile |
Platform log (.log file) | <knime-workspace>/.metadata/.log | Events from the underlying Eclipse platform, for example issues that occur during feature installation. | unlimited | not configurable via preference |
| Standard output | Terminal from which KNIME Analytics Platform was started. | Live stream of log events; useful in headless or container deployments. | not applicable | logging.loglevel.stdout |
| Standard error output | Terminal from which KNIME Analytics Platform was started. | Live stream of error log events; currently only used in KNIME Analytics Platform. | not applicable | not configurable via preference |
| Console (View) output | Console view in the Classic UI of KNIME Analytics Platform. | Live stream of log events similar to standard output, but visible in the GUI via View > Console. | not applicable | logging.loglevel.console |
Supported log levels
Whether a log event is logged to a particular log target is governed by the target’s configured minimum log level: only log events at that level or higher are logged to it.
All targets support the minimum log levels DEBUG, INFO, WARN, ERROR, and OFF, ordered by severity from less severe to more severe (or "off" to disable logging).
The default levels are:
- KNIME log and per-workflow logs:
WARN - Platform log:
DEBUG - Standard output:
INFO - Standard error:
ERROR - Console view:
WARN
Standard output and standard error are configured to always be non-overlapping.
Initial log messages are buffered until logging is fully initialized. If the application shuts down before logging is fully initialized, KNIME emits the buffered log messages and all subsequent log messages directly to the selected stream by using failsafe logging. In failsafe mode, KNIME ignores user preferences and the workspace log4j configuration. The following environment variables control failsafe logging:
KNIME_CORE_LOGGING_FAILSAFE_TARGET: write failsafe log output tostdoutorstderr, or set tooffto disable failsafe logging. Default:stdout.KNIME_CORE_LOGGING_FAILSAFE_MIN_LEVEL: minimum level for failsafe log output. Supported values areDEBUG,INFO,WARN,ERROR, andOFF. Default:DEBUG.
Since logging an event incurs some minimal performance penalty, enable the verbose
DEBUGorINFOlevels only when you need the extra detail; typically only while troubleshooting.
Changing the log level
You can change the log level for the KNIME log and per-workflow logs under Preferences > KNIME. Per-workflow logs can also be enabled or disabled entirely. Log events not specific to a particular workflow can be included in all per-workflow logs by enabling to log global messages to the workflow logs.
Configuration sources
KNIME reads configurations for log levels from several sources. If multiple configuration sources define the same preference for the minimum log level, a latter of the sources below overrides the earlier one. In other words, this list is sorted ascendingly by priority.
- Log4j defaults are located in the file
<knime-workspace>/.metadata/knime/log4j3.xmland use Log4j 1 configuration options. - Built-in defaults are listed under supported log levels above.
- Customization profiles can override built-in defaults by loading Eclipse preferences (
.epf) files into the KNIME Analytics Platform on startup. Usually, customization profiles are distributed via a KNIME Hub instance. If you are a KNIME Hub admistrator, see here for more information on setting log level preferences in customization profiles. - User changes are any adjustments you make under Preferences > KNIME (see the screenshot above). These take effect immediately and will override other sources for your installation.
For everyday and individual use you can simply set the log level for the KNIME log and pre-workflow logs in the preferences dialog.
Configuring KNIME Analytics Platform
Preferences
Preferences can be open by clicking Preferences in the top right corner of the Analytics Platform.
Here, a list of subcategories is displayed in the dialog that opens. Each category contains a separate dialog for specific settings like database drivers, available update sites, and appearance.
Network connections
Selecting General > Network Connections in the list of subcategories, allows you to define the networking and proxy setup of KNIME Analytics Platform.
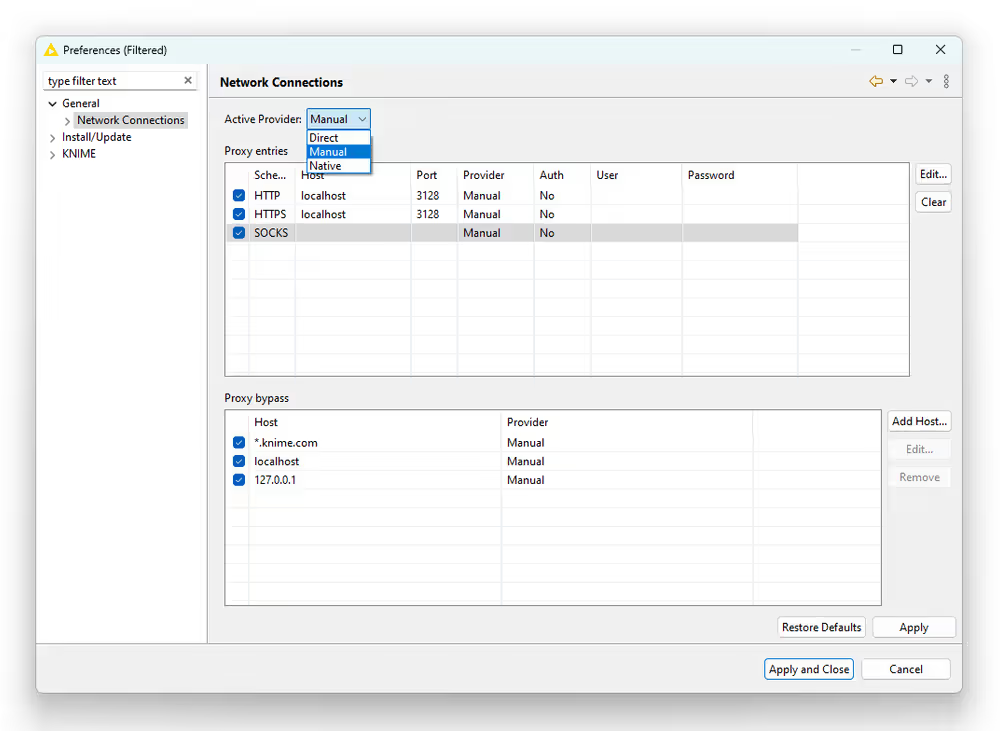
The Active Provider can be set to three options:
- The Direct provider bypasses all proxies.
- The Manual provider uses the proxy configuration you see on the page.
- The Native provider checks for proxy settings on the OS and loads them into preferences.
Manual proxy entries are distinguished by protocol, being HTTP, HTTPS, or SOCKS. For example, the HTTPS entry only affects requests to hosts which use that protocol, such as [https://www.knime.com](https://www.knime.com).
You can use the Executor Diagnostics workflow on your local Analytics Platform to investigate the settings on your machine and potential connection issues. To do so, download the workflow, execute it locally, and open the view of the Proxy Diagnostics Viewer.
Native proxies
Native proxies come from OS-specific, static or dynamic sources. A static proxy configuration is a hard-coded setting including the proxy host and its corresponding port. Dynamic proxy configuration is based on proxy auto-config (PAC) scripts. Proxies from this source will be labeled as Dynamic in the preferences.
Below you find an overview of which sources are supported in the different OSs.
| OS | Static source | Dynamic source |
|---|---|---|
| Windows | Proxies from the Windows system settings at Network & Internet > Proxy > Manual proxy setup > Use a proxy server. | PAC proxies defined at Network & Internet > Proxy > Automatic proxy setup > Use setup script. Note that this source does not work for all services. See below for more information. |
| macOS | Proxies are coming from the macOS system proxy settings. | Not supported. |
| Linux | First, the environment variables http_proxy, https_proxy, no_proxy are checked for proxies, then GNOME system settings at Network > Network Proxy are. | Not supported. |
As mentioned above, the native proxy support on Linux is limited to GNOME systems. Additionally, loading proxies from GNOME settings requires adding this entry to the knime.ini file.
-Dorg.eclipse.core.net.enableGnome=true
Dynamic proxies work well for core functionality of the KNIME Analytics Platform, such as fetching updates, reloading update sites, or installing extensions. However, they are not supported for node execution in general, with some exceptions. For example, the KNIME REST Client Extension does support dynamic proxy sources.
Proxy authentication
KNIME supports basic authentication at proxies, i.e. using a username and a password. You can set the proxy credentials on the same preferences page by enabling the Requires Authentication checkbox. The credentials are stored in the Eclipse secure storage.
If credentials are not found, the corresponding service in the KNIME Analytics Platform will receive the HTTP response 407.
To resolve missing proxy credentials, follow these steps:
- First, check that you correctly entered the credentials for the relevant protocol entry.
- If you are still seeing node or log messages like
Unable to tunnel through proxy. Proxy returns "HTTP/1.1 407 Proxy Authentication Required", it is likely that you are missing a property in theknime.inifile. See this FAQ entry for more information.
Proxy exclusion
On the preferences page, you can also exclude individual hosts from using the proxy. This makes sense for local or internal hosts, for example localhost or 127.0.0.1. Next to exact matching hostnames, using wildcards * allows you to exclude a range of hosts. It is important not to include the protocol of the URL, for example \https://.
Be aware that the exclusion pattern is matched to every HTTP-redirect. For example, excluding only the host knime.com will result in your request still using a proxy, since knime.com redirects to www.knime.com which was not excluded. For these cases, you can use the wildcard patterns, such as the pattern *knime.com.
KNIME
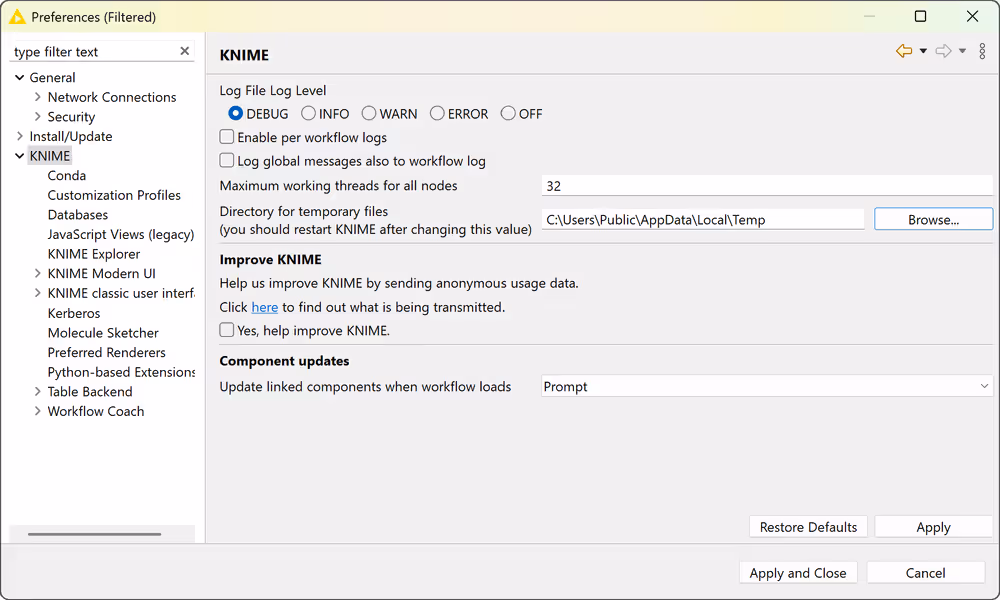
Selecting KNIME in the list of subcategories, allows you to define the log file log level. By default it is set to DEBUG. This log level helps developers to find reasons for any unexpected behavior.
Directly below, you can define the maximum number of threads for all nodes. Separate branches of the workflow are distributed to several threads to optimize the overall execution time. By default the number of threads is set to twice the number of CPUs on the running machine.
In the same dialog, you can also define the folder for temporary files.
Check the last option Yes, help improve KNIME. to agree to sending us anonymous usage data. This agreement activates the node recommendations in the quick node adding panel.
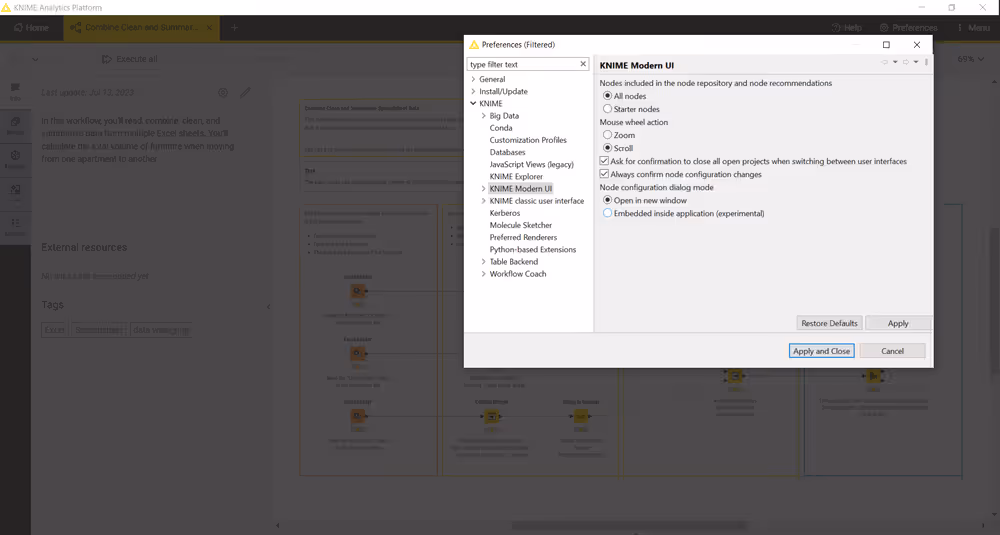
KNIME Modern UI
In the KNIME Modern UI category you can select:
Which nodes to include in the node repository and node recommendations
Which action is associated with the mouse wheel.
If you want to be asked to close the open projects when switching between Modern and Classic UI
If you want to confirm node configuration changes in order for them to be applied
How you want the node configuration dialogs to show up in the UI:
- Embedded inside application: With the release of KNIME Analytics Platform 5.4 we have introduced the possibility to see the node configuration dialogs embedded inside the application.
- Open in new window: Select this option to open them into a new window
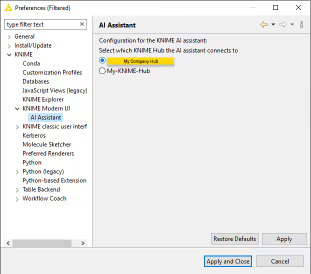
Under AI Assistant you can also, which KNIME Hub the AI assistant connects to. Here you can also disable the KNIME AI Assistant. The KNIME AI Assistant is enabled by default.
KNIME classic user interface
The KNIME category, contains a subcategory KNIME classic user interface. In this dialog, you can define the console view log level. By default it is set to "WARN", because more detailed information is only useful for diagnosis purposes.
Further below, you can select which confirmation dialogs are shown when using KNIME Analytics Platform. Choose from the following:
- Confirmation after resetting a node
- Deleting a node or connection
- Replacing a connection
- Saving and executing workflow
- Loading workflows created with a nightly build
In the same dialog, you can define what happens if an operation requires executing the previous nodes in the workflow. You have these three options:
- Execute the nodes automatically
- Always reject the node execution
- Show a dialog to execute or not
The following options allow you to define whether workflows should be saved automatically and after what time interval, also whether linked components and metanodes should be automatically updated. You can also define visual properties such as the border width of workflow annotations.
Table backend
Starting with KNIME Analytics Platform version 4.3 a new Columnar Backend is introduced, in order to optimize the use of main memory in KNIME Analytics Platform, where cell elements in a table are represented by Java objects by reviewing the underlying data representation.
The KNIME Columnar Table Backend extension addresses these issues by using a different underlying data layer (backed by Apache Arrow), which is based on a columnar representation.
The type of table backend used can be defined:
At the workflow level. Open a workflow and select the Description tab from the side panel navigation. Click the
 icon in the top right corner of the description panel. A workflow configuration dialog will open. Here, in the tab Table Backend you can select the desired backend for this specific workflow from the menu.
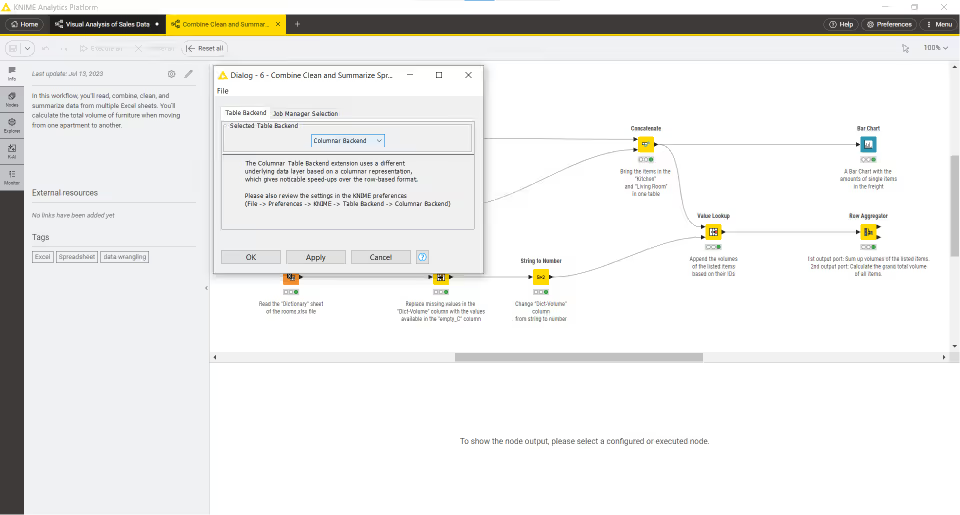
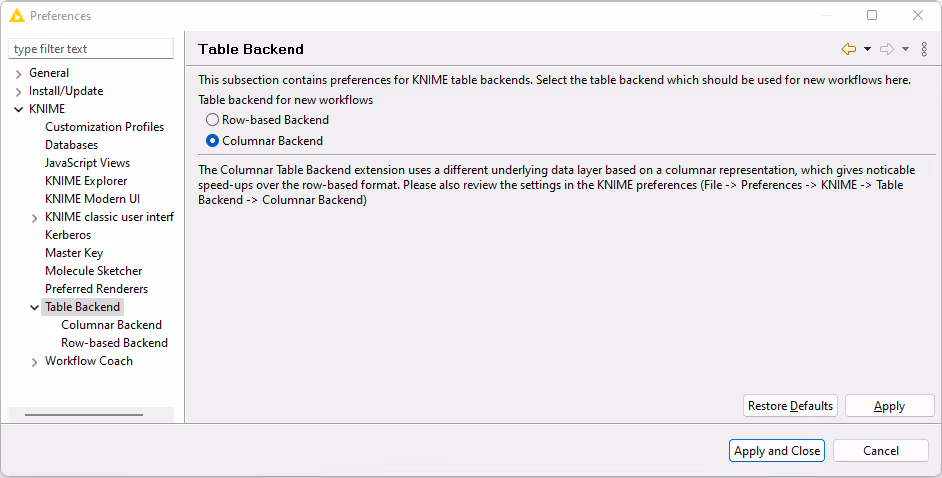
As default for all new workflows created. Open the KNIME Preferences and select Table Backend under KNIME in the left pane of the preferences window. Here you can select Columnar Backend as Table backend for new workflows.
The parameters relative to memory usage of the Columnar Backend can also be configured. Go to File → Preferences and select Table Backend → Columnar Backend under KNIME in the left pane of the preferences window.
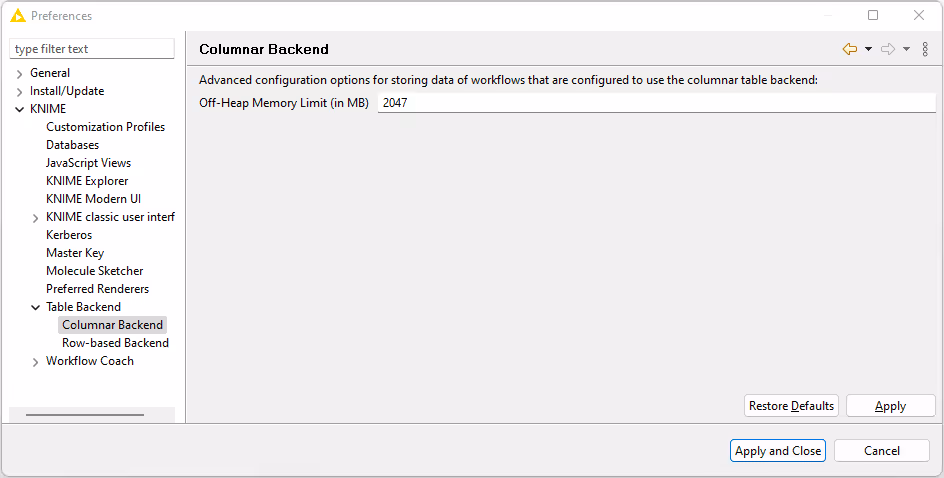
Note that the caches of the Columnar Backend that reside in the off-heap memory region require an amount of memory in addition to whatever memory you have allotted to the heap space of your KNIME’s Java Virtual Machine via the -Xmx parameter in the knime.ini. When altering the sizes of these cache via the preferences page, make sure not to exceed your system’s physical memory size as otherwise you might encounter system instability or even crashes.
For a more detailed explanation of the Columnar Backend technical background please refer to this post on KNIME Blog.
High memory usage on Linux: On some Linux systems KNIME Analytics Platform can allocate more system memory than expected when using the Columnar Backend. This is caused by an unfavorable interaction between the JVM and the glibc native memory allocator.
To work around this issue, you can reduce the number of allowed malloc areas by running KNIME Anayltics Patform with the environment variable MALLOC_ARENA_MAX set to 1.
Setting up knime.ini
When installing KNIME Analytics Platform, configuration options are set to their defaults. The configuration options, i.e. options used by KNIME Analytics Platform, range from memory settings to system properties required by some extensions.
You can change the default settings in the knime.ini file. The knime.ini file is located in the installation folder of KNIME Analytics Platform.
To locate the
knime.inifile on macOS, open Finder and navigate to the installed Applications.
Next, right click the KNIME application, select Show Package Contents in the menu, and navigate to Contents, and open Eclipse.
Edit the knime.ini file with any plaintext editor, such as Notepad (Windows), TextEdit (macOS) or gedit (Linux).
The entry -Xmx1024m in the knime.ini file specifies how much memory KNIME Analytics Platform is allowed to use. The setting for this value will depend on how much memory is available in the running machine. We recommend setting it to approximately one half of the available memory, but this value can be modified and personalized. For example, if the computer has 16GB of memory, the entry might be set to -Xmx8G. Besides the memory available, you can define many other settings in the knime.ini file. The table below provides an overview of some of the most common settings. For a complete list of configuration options, see the KNIME Core repository.
| Setting | Explanation |
|---|---|
-Xmx- default value: 1024m- example: -Xmx16G | Sets the maximum amount of memory available for KNIME Analytics Platform. |
-Dknime.compress.io- default value: SNAPPY- possible values: [SNAPPY|GZIP|NONE]- example: -Dknime.compress.io=SNAPPY | Determines which compression algorithm (if any) to use when writing temporary tables to disk. |
-Dorg.knime.container.cellsinmemory- default value: 5,000 - possible values: any value between 0 and 2,147,483,647 - example: -Dorg.knime.container.cellsinmemory=100,000 | This setting defines the size of a "small table". Small tables are attempted to be kept in memory, independent of the table caching strategy. By increasing the size of a small table, the number of swaps to the disk can be limited, which comes at the cost of reducing memory space available for other operations. |
-Dknime.layout_editor.browser- default value version 4.7.2: swt - possible values: [cef|swt]- example: -Dknime.layout_editor.browser=cef | This setting defines which browser should be used to display the layout editor. |
-Dknime.table.cache- default value: LRU- possible values: [LRU|SMALL]- example: -Dknime.table.cache=SMALL | Determines whether to attempt to cache large tables in memory. If set to LRU, large tables are evicted from memory in least-recently used order or when memory becomes scarce. If set to SMALL, large tables are always flushed to disk. |
-Dknime.url.timeout- default value: 1,000 ms - example: -Dknime.url.timeout=100 | Discouraged. Use knime.url.connectTimeout and knime.url.readTimeout instead. Sets both timeouts to the same value. |
-Dknime.url.connectTimeout- default value: 5,000 ms - example: -Dknime.url.connectTimeout=8000 | When trying to connect to a web host via URL, this value defines a timeout for the request. Increase if you see connection timeout errors. |
-Dknime.url.readTimeout- default value: 20,000 ms - example: -Dknime.url.readTimeout=32000 | When trying to read data from a URL, this value defines a timeout for the request. Increase if a reader node fails. |
-Dchromium.block_all_external_requests- default value: false - example: -Dchromium.block_all_external_requests=true | When set to true, blocks all external requests made by Chromium Embedded Framework. |
-Dknime.python.cacerts- default value: ENV - example: -Dknime.python.cacerts=ENV | Controls which certificate authorities Python processes trust. If set to ENV, trusts CA from Python environment. If set to AP, trusts CA from Analytics Platform. |
KNIME runtime options
KNIME’s runtime behavior can be configured in various ways by passing options on the command line during startup. Since KNIME is based on Eclipse, all Eclipse runtime options also apply to KNIME.
KNIME also adds additional options, which are described below.
Command line arguments
Listed below are the command line arguments processed by KNIME. They can either be specified permanently in the knime.ini in the root of the KNIME installation, or be passed to the KNIME executable. Please note that command line arguments must be specified before the system properties (see below) i.e. before the -vmargs parameter.
Note that headless KNIME applications, such as the batch executor, offer quite a few command line arguments. They are not described here but are printed if you call the application without any arguments.
-checkForUpdates
If this arguments is used, KNIME automatically checks for updates during startup. If new versions of installed features are found, the user will be prompted to install them. A restart is required after updates have been installed.
Java system properties
Listed below are the Java system properties with which KNIME’s behavior can be changed. They can either be specified permanently in the knime.ini in the root of the KNIME installation, or be passed to the KNIME executable. Please note that system properties must be specified after the -vmargs parameter. The required format is -DpropName=propValue.
General properties
| Property | Explanation |
|---|---|
org.knime.core.maxThreads=_<number>_ | Sets the maximum number of threads that KNIME is using for executing nodes. By default this number is 1.5 times the number of cores. This property overrides the value from the KNIME preferences page. |
knime.tmpdir=_<directory>_ | Sets the default directory for temporary files KNIME files (such as data files). This property overrides the value from the preferences pages and is by default the same as the java.io.tmpdir. |
knime.synchronous.io=_(true|false)_ | Can be used to enforce the sequential processing of rows for KNIME tables. By default, each table container processes its rows asynchronously in a number of (potentially re-used) threads. The default value is false. Setting this field to true will instruct KNIME to always handle rows sequentially and synchronously, which in some cases may be slower. |
knime.async.io.cachesize=_<number>_ | Sets the batch size for non-sequential and asynchronous handling of rows (see knime.synchronous.io). It specifies the amount of data rows that are handled by a single container thread. The larger the buffer, the smaller the synchronization overhead but the larger the memory requirements. This property has no effect if rows are handled sequentially. The default value is 10. |
knime.domain.valuecount=_<number>_ | The number of nominal values kept in the domain when adding rows to a table. This is only the default and may be overruled by individual node implementations. If no value is specified a default of 60 will be used. |
org.knime.container.threads.total=_<number>_ | Sets the maximum number of threads that can be used to write KNIME native output tables. By default this number equals the number of processors available to the JVM. Note: This value has to be greater than 0. |
org.knime.container.threads.instance=_<number>_ | Sets the maximum number of threads that can be used to write a single KNIME native output table. By default this number equals the number of processors available to the JVM. Note: This value has to be greater than 0 and cannot be larger than org.knime.container.threads.total. |
knime.discourage.gc=_(true|false)_ | If set to true, discourages KNIME from triggering a full stop-the-world garbage collection. Note that (a) individual nodes are allowed to disregard this setting and (b) the garbage collector may independently decide that a full stop-the-world garbage collection is warranted. Set to true by default. |
org.knime.container.minspace.temp=_<number>_ | Java property to specify the minimum free disc space in MB that needs to be available. If less is available, no further table files & blobs will be created (resulting in an exception). |
knime.columnar.chunksize=_<number>_ | The columnar table backend horizontally divides tables into batches and vertically divides these batches into column chunks. This property controls the initial size of these chunks and thereby the number of rows per batch. A chunk is the smallest unit that must be materialized to access a single value. Changing this value can therefore impact memory footprint and overall performance. Do not change this value unless you have good reasons. The default value is 28,000. |
knime.columnar.reservedmemorymb=_<number>_ | The columnar table backend caches table data off-heap. To this end, it requires memory in addition to the JVM's heap memory, whose size is controlled via the -Xmx parameter. If no explicit cache sizes are set in the preferences, the default memory available for caching is computed as follows: Total physical memory minus reserved memory minus 1.25 times heap memory. The reserved memory size in this equation (in MB) can be configured via this property. The default is 4,096. |
knime.columnar.verbose=_(true|false)_ | Setting this property to true activates verbose debug logging in the columnar table backend. |
knime.disable.rowid.duplicatecheck=_(true|false)_ | Enables/disables row ID duplicate checks on tables. Tables in KNIME are supposed to have unique IDs, whereby the uniqueness is asserted using a duplicate checker. This property will disable this check. Warning: This property should not be changed by the user. |
knime.disable.vmfilelock=_(true|false)_ | Enables/disables workflow locks. As of KNIME 2.4 workflows will be locked when opened; this property will disable the locking (allowing multiple instances to have the same workflow open). Warning: This property should not be changed by the user. |
knime.database.timeout=_<number>_ | Sets the timeout in seconds trying to establish a connection to a database. The default value is 15 seconds. |
knime.database.fetchsize=_<number>_ | Sets the fetch size for retrieving data from a database. The default value depends on the used JDBC driver. |
knime.database.batch_write_size=_<number>_ | Sets the batch write size for writing data rows into a database. The default value is 1, that is one row at a time. |
knime.database.enable.concurrency=_(true|false)_ | Used to switch on/off the database connection access (applies only for the same database connection). Default is true, that is all database accesses are synchronized based on single connection; false means off, that is, the access is not synchronized and may lead to database errors. |
knime.logfile.maxsize=_<number>_[mk] | Allows one to change the maximum log file size (default is 10 MB). Values must be integer, possibly succeeded by "m" or "k" to denote that the given value is in mega or kilo byte. |
knime.settings.passwords.forbidden=_(true|false)_ | If true, nodes using passwords as part of their configuration (e.g. DB connection or SendEmail) will not store the password as part of the workflow on disc. Instead a null value is stored, which will cause the node's configuration to be incorrect (but valid) after the workflow is restored from disc. Default is false. |
knime.repository.non-instant-search=_(true|false)_ | Allows to disable the live update in the node repository search. |
knime.macosx.dialogworkaround=_(true|false)_ | Allows to disable the workaround for freezes when opening node dialogs under macOS. |
knime.data.bitvector.maxDisplayBits=_<number>_ | Sets the maximum number of bits that are display in string representations of Bit Vectors. |
knime.xml.disable_external_entities=_(true|false)_ | If set to true, all nodes that parse XML files will not read external entities defined via a DTD. This is usually only useful when running as an executor on the server and you want prevent XXE attacks. |
Plug-in dependent properties
These properties only affect some plug-ins and are only applicable if they are installed.
| Property | Explanation |
|---|---|
org.knime.cmlminblobsize=_<number>_[mMkK] | Allows you to change the minimum size in bytes (or kilobyte or megabytes) a CML molecule must have before it is stored in a blob cell. Otherwise it is stored inline. The latter is faster but requires more memory. The default is 8kB. |
org.knime.ctabminblobsize=_<number>_[mMkK] | Allows you to change the minimum size in bytes (or kilobyte or megabytes) a Ctab molecule must have before it is stored in a blob cell. Otherwise it is stored inline. The latter is faster but requires more memory. The default is 8kB. |
org.knime.mol2minblobsize=_<number>_[mMkK] | Allows you to change the minimum size in bytes (or kilobyte or megabytes) a Mol2 molecule must have before it is stored in a blob cell. Otherwise it is stored inline. The latter is faster but requires more memory. The default is 8kB. |
org.knime.molminblobsize=_<number>_[mMkK] | Allows you to change the minimum size in bytes (or kilobyte or megabytes) a Mol molecule must have before it is stored in a blob cell. Otherwise it is stored inline. The latter is faster but requires more memory. The default is 8kB. |
org.knime.rxnminblobsize=_<number>_[mMkK] | Allows you to change the minimum size in bytes (or kilobyte or megabytes) a Rxn molecule must have before it is stored in a blob cell. Otherwise it is stored inline. The latter is faster but requires more memory. The default is 8kB. |
org.knime.sdfminblobsize=_<number>_[mMkK] | Allows you to change the minimum size in bytes (or kilobyte or megabytes) a SDF molecule must have before it is stored in a blob cell. Otherwise it is stored inline. The latter is faster but requires more memory. The default is 8kB. |
KNIME tables
Data table
Very common input and output ports of nodes are data input ports and data output ports, which correspond to the black triangles.

A data table is organized by columns and rows, and it contains a number of equal-length rows. Elements in each column must have the same data type.
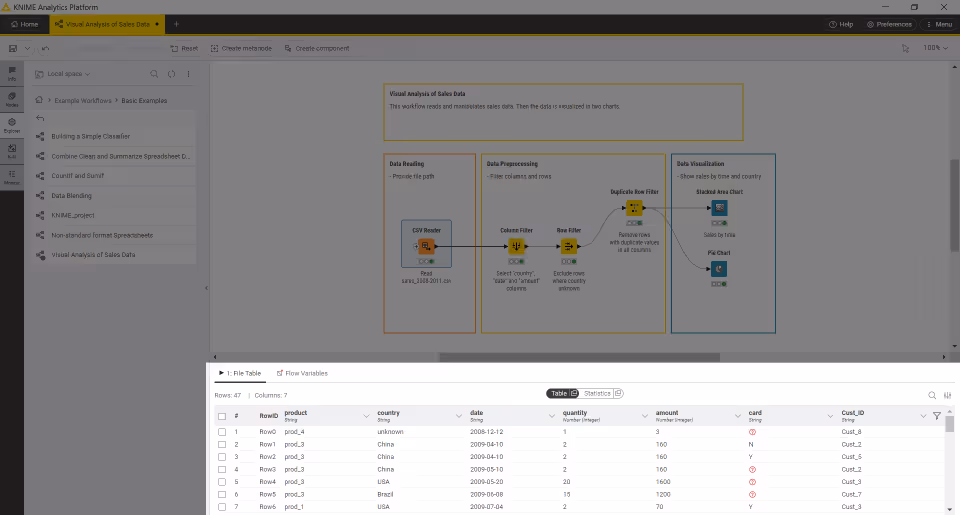
The data table is produced by a CSV Reader node, which is one of the many nodes with a black triangle output port for data output. To open the table, click the node. Execute the node if it is not yet execute. The table will show up in the node monitor:
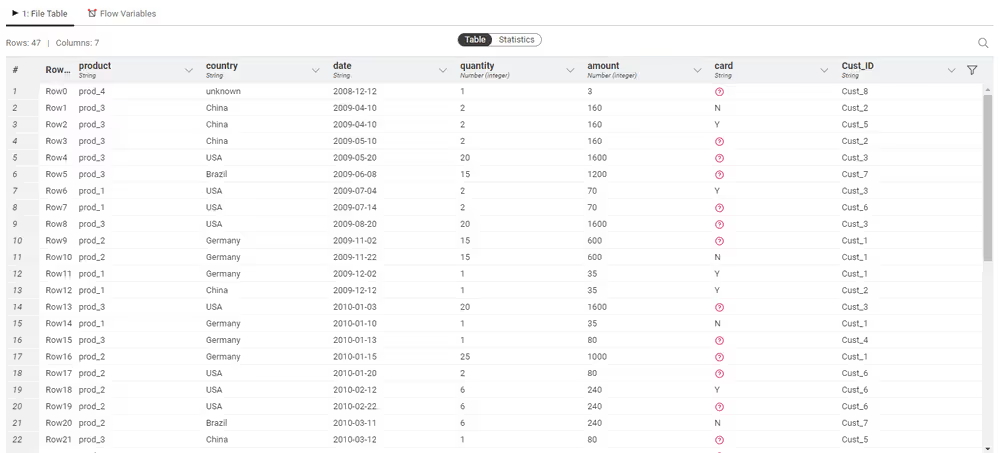
The output table has row numbers, unique RowIDs and column headers. The RowIDs are automatically created by the reader node, but they can also be defined manually. The RowIDs and the column headers can therefore be used to identify each data cell in the table. Missing values in the data are shown by a red question mark in a circle.
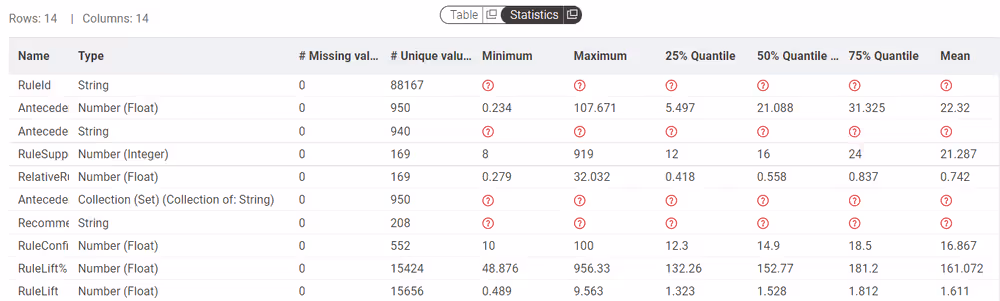
At the top of the node monitor you can select which output port you want to view via the tabs and the flow variable tab, which shows the available flow variables in the node output and their current values. Next row will indicate the table dimensions, meaning how many rows and how many columns there are in the table at that specific output port. Here you can also use the toggle to switch to Statistics. This tab shows the meta information of the table, like the columns names, columns types and some other statistics data.
Column types
The basic data types in KNIME Analytics Platform are:
- Number (Integer)
- Number (Long Integer)
- Number (Float)
- String
- Boolean
- Collection (List) and Collection (Set)
- HTML
- JSON
- XML
- URI
- Path
- Document
- Date
- Time
- Date&time (Local) and Date&time (Zoned)
- Duration (Time-based) and Duration (Date-based)
- Bit Vector and Bit Vector (Sparse)
- Byte Vector
- Image (PNG) and Image (SVG)
- Model (PMML)
Some Extensions provide additional data types. For example, the chemistry extensions provide data types for chemical structures, such as:
- CDXML
- InChI
- SMARTS
- SMILES
Switch to the Statistics view in an output table, to see the data types of the columns in the data table. For numerical values, only the range of the values in the data is shown. For string values, the different values appearing in the data are shown.
The reader nodes in KNIME Analytics Platform assign a data type to each column based on their interpretation of the content. If the correct data type of a column is not recognized by the reader node, the data type can be corrected afterwards. There are nodes available to convert data types. For example: String to Number, Number to String, Double to Int, String to Date&Time, String to JSON, and String to URI.
Many of the special data types are recognized as String by the reader nodes. To convert these String columns to their correct data types, use the Column Type Auto Cast node.
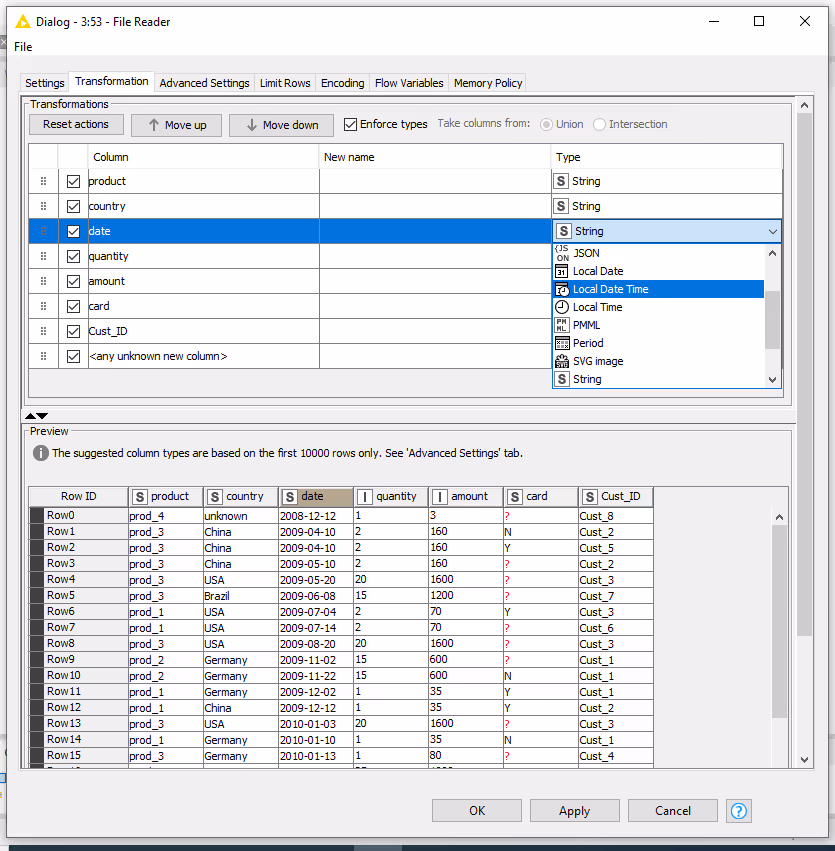
When you use the File Reader node to read a file you can convert the column types directly via the node configuration dialog. To do so go to the Transformation tab in the configuration dialog and change the type of the desired column.
Sorting
Rows in the table view output can be sorted by values in one column by clicking the up (ascending) and down (descending) arrow that appears hovering over the column name in the header. Note that this sorting only affects the current output view and has no effect on the node output.
To sort rows in an output table permanently, use the Sorter node. Use the Column Resorter node to reorder columns.
Column rendering
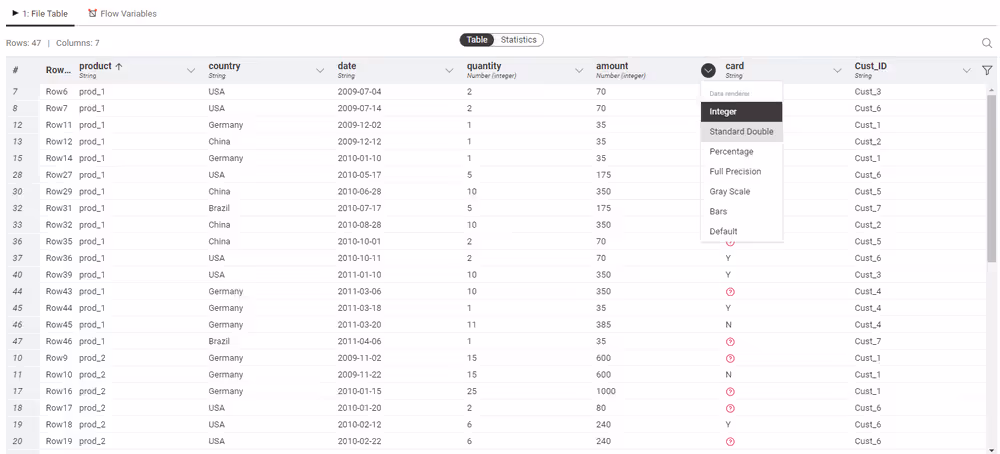
In a table view output, you can also change the way in which numeric values are displayed in a data table. For example, it is possible to display numeric values as percentages, with full precision, or replace digits by a grey scale or bars. To see these and other rendering options for a column, click the carat icon in the column header, and select the desired available renderer. Note that these changes are temporary and have no effect on the node output.
If you hover over table cells containing data of type JSON, XML, or images (.svg or .png) and click the ![]() icon, a content preview will be shown, rendered in a readable format.
icon, a content preview will be shown, rendered in a readable format.
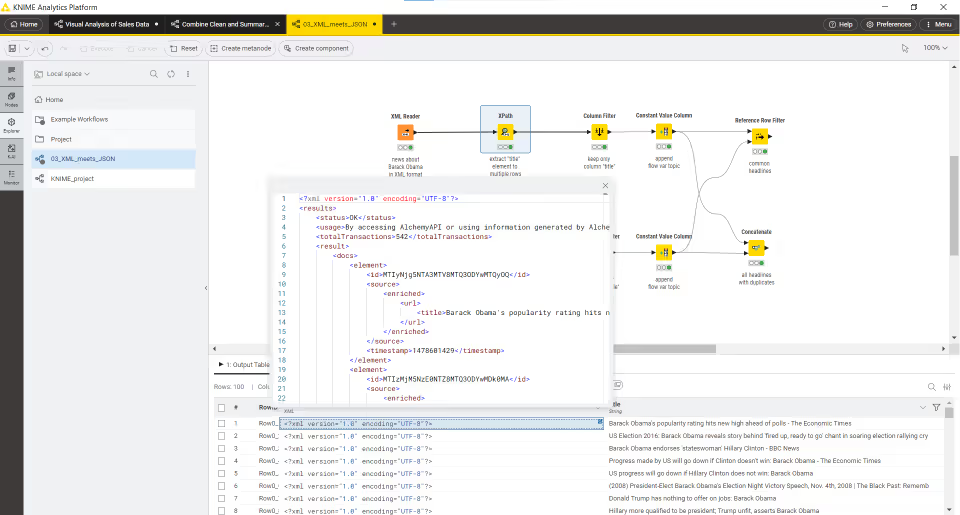
Table storage
When executed, many KNIME nodes generate and provide access to tabular data at their output ports. These tables might be small or large and, therefore, might fit into the main memory of the executing machine or not. Several options are available for configuring which tables to hold in memory as well as when and how to write tables to disk. These options are outlined in this section.
In-memory caching
KNIME Analytics Platform differentiates between small and large tables. Tables are considered to be small (large) when they are composed of up to (more than) 5000 cells. This threshold of 5000 cells can be adjusted via the -Dorg.knime.container.cellsinmemory parameter in the knime.ini file. KNIME Analytics Platform always attempts to hold small tables in memory, flushing them to disk only when memory becomes scarce.
In addition, KNIME Analytics Platform attempts to keep recently used large tables in memory while sufficient memory is available. However, it writes these tables asynchronously to disk in the background, such that they can be dropped from memory when they have not been accessed for some time or when memory becomes scarce. You can configure the memory consumption of a specific node to never attempt to hold its tables in memory and, instead, write them to disk on execution. This is helpful if you know that a node will generate a table that cannot be held in memory or if you want to reduce the memory footprint of a node.
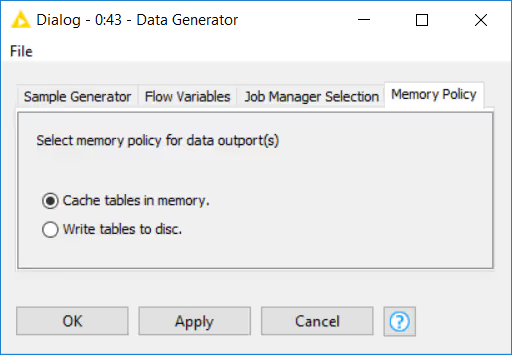
Figure 46. Configuring a node’s memory policy
Alternatively, by putting the line -Dknime.table.cache=SMALL into the knime.ini file, KNIME Analytics Platform can be globally configured to use a less memory-consuming, albeit much slower caching strategy. This strategy only ever keeps small tables in memory.
Disk storage
KNIME Analytics Platform compresses tables written to disk to reduce the amount of occupied disk space. By default, KNIME Analytics Platform uses the Snappy compression algorithm to compress its tables. However, you can configure KNIME Analytics Platform to use GZIP compression or no compression scheme at all via the -Dknime.compress.io parameter in the knime.ini file.
Columnar Backend
Starting with KNIME Analytics Platform version 4.3 a new Columnar Backend is introduced. This extension addresses these issues by using a different underlying data layer (backed by Apache Arrow), which is based on a columnar representation.
For information on how to set up this type of backend please refer to the Table backend section.
Shortcuts
Shortcuts in KNIME Analytics Platform allow you to speed up your workflow building process. Navigate to the Help button in the top right corner of the user interface. Select Show keyboard shortcuts. In the shortcuts window, the shortcut name is displayed on the left and the respective key sequence on the right. You can filter shortcuts according to their name and key.
The listed shortcuts are available for the KNIME Modern UI. They cannot be changed at the moment. Eclipse preferences have no impact on them.
General actions
| Action | Mac | Windows & Linux |
|---|---|---|
| Close workflow | ⌘ W | Ctrl + W |
| Create workflow | ⌘ N | Ctrl + N |
| Switch to next opened workflow | ⌘ ⇥ | Ctrl + Tab |
| Switch to previous opened workflow | ⌘ ⇧ ⇥ | Ctrl + Shift + Tab |
| Save | ⌘ S | Ctrl + S |
| Undo | ⌘ Z | Ctrl + Z |
| Redo | ⌘ ⇧ Z | Ctrl + Shift + Z |
| Delete | ⌫ / ⌦ | Delete |
| Copy | ⌘ C | Ctrl + C |
| Cut | ⌘ X | Ctrl + X |
| Paste | ⌘ V | Ctrl + V |
| Export | ⌘ E | Ctrl + E |
| Select all objects | ⌘ A | Ctrl + A |
| Deselect all objects | ⌘ ⇧ A | Ctrl + Shift + A |
| Copy selected table cells | ⌘ C | Ctrl + C |
| Activate the filter input field | ⌘ ⇧ F | Ctrl + Shift + F |
| Copy selected table cells and corresponding header | ⌘ ⇧ C | Ctrl + Shift + C |
| Close any dialog unsaved | Esc | Esc |
Execution
| Action | Mac | Windows & Linux |
|---|---|---|
| Configure | F6 | F6 |
| Configure flow variables | ⇧ F6 | Shift + F6 |
| Execute all | ⇧ F7 | Shift + F7 |
| Cancel all | ⇧ F9 | Shift + F9 |
| Reset all | ⇧ F8 | Shift + F8 |
| Execute | F7 | F7 |
| Open view | F10 | F10 |
| Cancel | F9 | F9 |
| Reset | F8 | F8 |
| Resume loop | ⌘ ⌥ F8 | Ctrl + Alt + F8 |
| Pause loop | ⌘ ⌥ F7 | Ctrl + Alt + F7 |
| Step loop | ⌘ ⌥ F6 | Ctrl + Alt + F6 |
| Close dialog and execute node | ⌘ ↩ | Ctrl + ↵ |
Loops
Find out more about loop commands in the KNIME Analytics Platform Flow Control Guide.
Selected node actions
| Action | Mac | Windows & Linux |
|---|---|---|
| Activate the n-th output port view | ⇧ 1-9 | Shift + 1-9 |
| Activate flow variable view | ⇧ 0 | Shift + 0 |
| Detach the n-th output port view | ⇧ ⌥ 1-9 | Shift + Alt + 1-9 |
| Detach flow variable view | ⇧ ⌥ 0 | Shift + Alt + 0 |
| Detach active output port view | ⇧ ⌥ ↩ | Shift + Alt + ↵ |
| Edit node comment | F2 | F2 |
| Select (next) port | ⌃ P | Alt + P |
| Move port selection | ← → ↑ ↓ | ← → ↑ ↓ |
| Apply label changes and leave edit mode | ⌘ ↩ | Ctrl + ↵ |
Workflow annotations
Workflow annotations
| Action | Mac | Windows & Linux |
|---|---|---|
| Selection mode (default) | V | V |
| Pan mode | P | P |
| Annotation mode | T | T |
| Leave Pan or Annotation mode | ESC | ESC |
| Edit annotation | F2 | F2 |
| Bring to front | ⌘ ⇧ PageUp | Ctrl + Shift + PageUp |
| Bring forward | ⌘ PageUp | Ctrl + PageUp |
| Send backward | ⌘ PageDown | Ctrl + PageDown |
| Send to back | ⌘ ⇧ PageDown | Ctrl + Shift + PageDown |
| Normal text | ⌘ 0 | Ctrl + Alt + 0 |
| Headline 1 - 6 | ⌘ ALT 1 - 6 | Ctrl + Alt + 1-6 |
| Bold | ⌘ B | Ctrl + B |
| Italic | ⌘ I | Ctrl + I |
| Underline | ⌘ U | Ctrl + U |
| Strikethrough | ⌘ ⇧ S | Ctrl + Shift + S |
| Ordered list | ⌘ ⇧ 7 | Ctrl + Shift + 7 |
| Bullet list | ⌘ ⇧ 8 | Ctrl + Shift + 8 |
| Add or edit link | ⌘ K | Ctrl + K |
| Increase height | ⌥ ↓ | Alt + ↓ |
| Decrease height | ⌥ ↑ | Alt + ↑ |
| Increase width | ⌥ ← | Alt + ← |
| Decrease width | ⌥ → | Alt + → |
Workflow editor modes
| Action | Mac | Windows & Linux |
|---|---|---|
| Selection mode (default) | V | V |
| Pan mode | P | P |
| Annotation mode | T | T |
| Leave Pan or Annotation mode | ESC | ESC |
Workflow editor actions
| Action | Mac | Windows & Linux |
|---|---|---|
| Quick add node | ⌘ . | Ctrl + . |
| Connect nodes | ⌘ L | Ctrl + L |
| Connect nodes by flow variable port | ⌘ K | Ctrl + K |
| Disconnect nodes | ⌘ ⇧ L | Ctrl + Shift + L |
| Disconnect nodes' flow variable ports | ⌘ ⇧ K | Ctrl + Shift + K |
| Select node inside the quick nodes panel | ← → ↑ ↓ | ← → ↑ ↓ |
| Add node from quick nodes panel | ↩ | ↵ |
| Moving the selection rectangle to the next element | ← → ↑ ↓ | ← → ↑ ↓ |
| Select multiple elements | hold ⇧ and press ←/→/↑/↓ then select via ↩ | hold Shift and press ←/→/↑/↓ then select via ↵ |
| Move selected elements up | ⌘ ⇧ ↑ | Ctrl + Shift + ↑ |
| Move selected elements down | ⌘ ⇧ ↓ | Ctrl + Shift + ↓ |
| Move selected elements right | ⌘ ⇧ → | Ctrl + Shift + → |
| Move selected elements left | ⌘ ⇧ ← | Ctrl + Shift + ← |
Component and metanode building
| Action | Mac | Windows & Linux |
|---|---|---|
| Create metanode | ⌘ G | Ctrl + G |
| Create component | ⌘ J | Ctrl + J |
| Open component or metanode | ⌘ ⌥ ↩ | Ctrl + Alt + ↵ |
| Open parent workflow | ⌘ ⌥ ⇧ ↩ | Ctrl + Alt + Shift + ↵ |
| Expand metanode | ⌘ ⇧ G | Ctrl + Shift + G |
| Expand component | ⌘ ⇧ J | Ctrl + Shift + J |
| Rename component or metanode | ⇧ F2 | Shift + F2 |
| Open layout editor | ⌘ D | Ctrl + D |
| Open layout editor of selected component | ⌘ ⇧ D | Ctrl + Shift + D |
Zooming, panning and navigating inside the canvas
| Action | Mac | Windows & Linux |
|---|---|---|
| Fit to screen | ⌘ 2 | Ctrl + 2 |
| Fill entire screen | ⌘ 1 | Ctrl + 1 |
| Zoom in | ⌘ + | Ctrl + + |
| Zoom out | ⌘ - | Ctrl + - |
| Zoom to 100% | ⌘ 0 | Ctrl + 0 |
| Pan | hold "SPACE" and drag | hold "SPACE" and drag |
Table 11. The supported shortcut related to
Panel navigation
| Action | Mac | Windows & Linux |
|---|---|---|
| Hide or show side panel | ⌘ P | Ctrl + P |
Others
| Action | Mac | Windows & Linux |
|---|---|---|
| Reset interface scale | ⌘ ⌥ 0 | Ctrl + Alt + 0 |
Troubleshooting
Find here a list of common problems with resolutions regarding KNIME Analytics Platform.
Downloading or opening workflows from KNIME Community Hub is blocked by firewall
To solve this issue whitelist the following in your firewall:
https://*.amazonaws.com/
https://*.hub.knime.com