
Reporting
Introduction
This guide describes the Knime Reporting Extension, and shows how to create simple and advanced reports.
The Knime Reporting Extension allows you to create static reports based on the results of your workflows. You can automatically generate and distribute customized reports for recurring events such as month-end close, quarterly performance, or on-demand statistics. For instance, you can send a PDF email report based on your data.
To visualize your results, you can include nodes from the Knime Views Extension.
Working with the Reporting Extension in Knime
In the following section, you will recreate the Reporting minimal example workflow.
This workflow demonstrates how to access and visualize data, that is eventually converted into a report with nodes from the Knime Reporting Extension. If you have not already done so, you can download the workflow from the Knime Community Hub and reference it as needed.
As a starting point, you are provided with a basic data table. First, you want to access and visualize the data.
Step 1: Read the data
Download the .csv file from here. Then drag the .csv file onto the workflow canvas. This automatically opens and configures a CSV Reader node.
Step 2: Add views to your workflow and create a component
Add views
A crucial part to conveying a comprehensible overview of your data to the end user is visualization. To do this, you can use the nodes from the Knime Views Extension. They integrate directly with the Knime Reporting Extension.
Python-based view nodes, such as the Geospatial View node, are also supported by the Knime Reporting Extension.
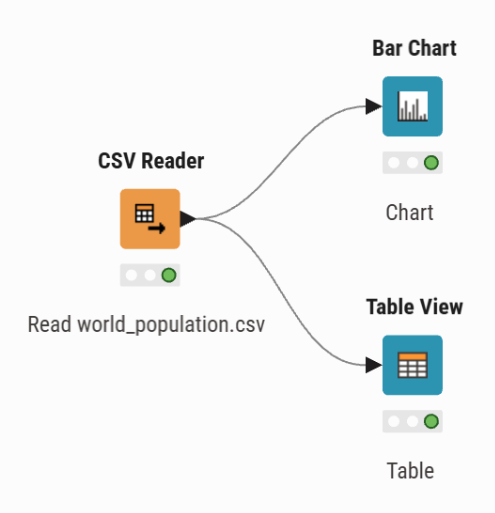
In order to display the world population data, you can choose the chart that best fits your data. In this example, to visualize the data you can use a bar chart and view the population per country in a table.
To add the views, drag a connection to your workflow canvas. In the quick node insertion panel, locate the Bar Chart node and add it to your workflow. Repeat this step for the Table View node.
View nodes from the Knime JavaScript Views Extension or the Knime Plotly Extension are not directly supported by the Knime Reporting Extension.
Add rich text to your report
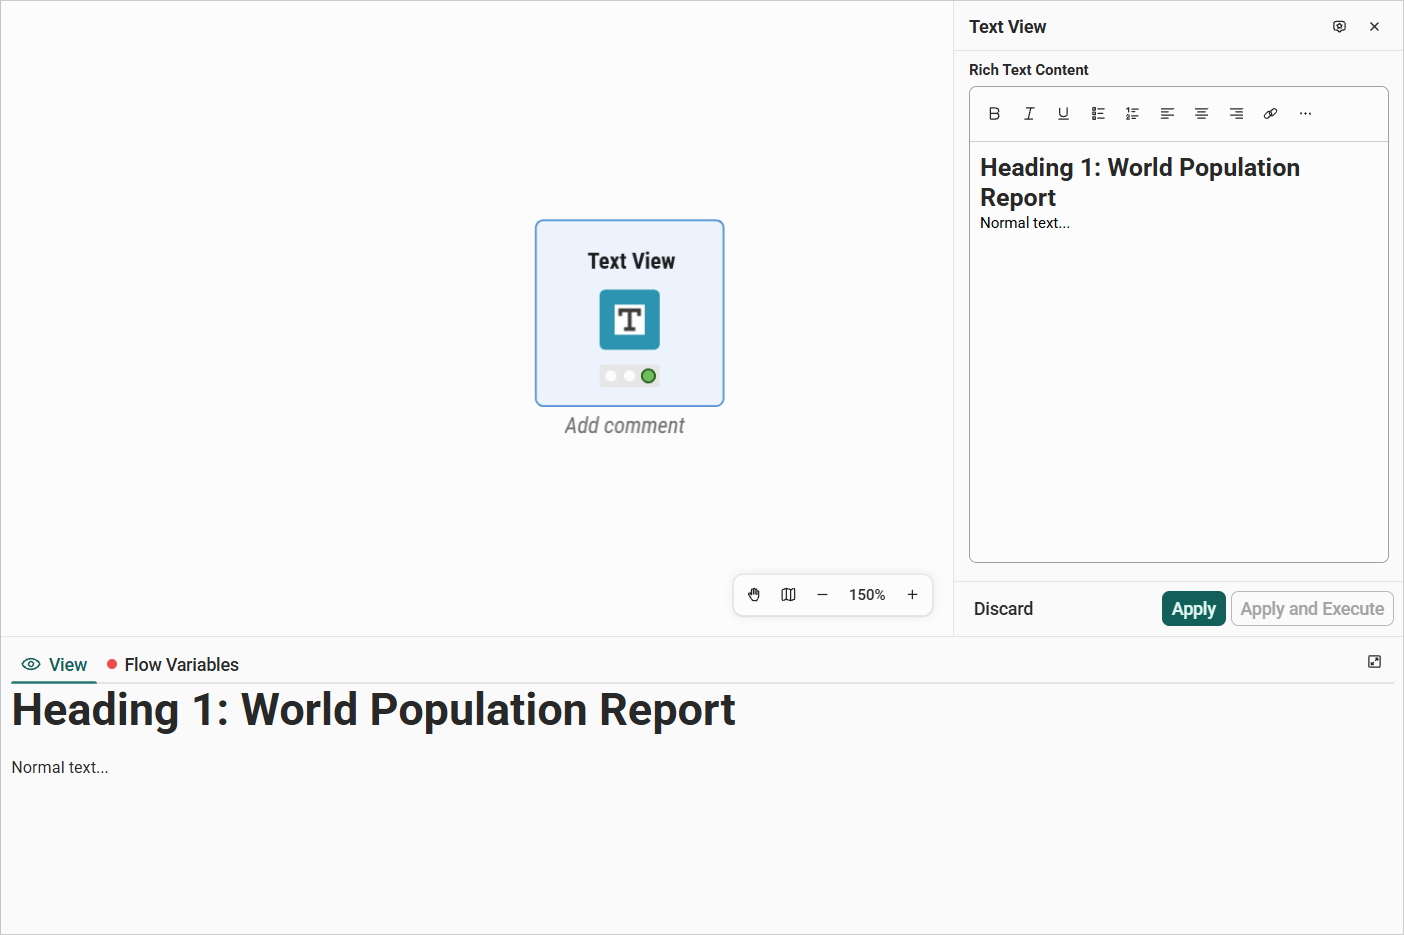
The Knime Views Extension also allows you to add text to your report. Search for the Text View node, then drag it to your workflow canvas. Click on the node to open the configuration dialog. It shows a preview of the text. You can manipulate it in the Rich Text Content editor on the right. At the top of the editor you can choose between the following formatting options (from left to right):
Text formatting
You can change the text formatting to:
- Bold (Ctrl B)
- Italic (Ctrl I)
- Underlined (Ctrl U)
- Hyperlink (Ctrl K)
Additionally, you can add bullet points, create a list and align your text (to the left, right, or center).
Click the ⋯ icon to open a dropdown menu, which gives you access to more customization styles like adding block quotes, code blocks, strikethrough text, or dividers to the text. The text style element also allows you to write in standard or small text, and to create headings. Alternatively, you can create a heading by adding number signs (#), followed by a space, in front of a word or phrase. The total amount of hash symbols should correspond to the heading level.
Flow variables
The contents of flow variables can be inserted by using the replacement syntax $$["flow-variable-name"].
See the Knime Components Guide to learn more about the usage of View nodes.
Create a component
Fundamentally, the report you are creating consists of a component’s composite view. To include the view nodes in your report, wrap them in a component. First select the nodes, then right-click the selection and click Create component in the dropdown menu. Open the component by double-clicking it while holding down the Ctrl key, or right-clicking and choosing Component → Open component from the dropdown menu. The sub-workflow contained inside the component is displayed.
Open the layout editor
To customize the composite view, use the layout editor. Select Open layout editor from the toolbar at the top. The layout editor automatically creates a layout, but it also allows you to customize it with a drag and drop grid. If you want to reorder the the view elements, you can simply drag and drop them to the desired position. This is explained in further detail in the Knime Components Guide.
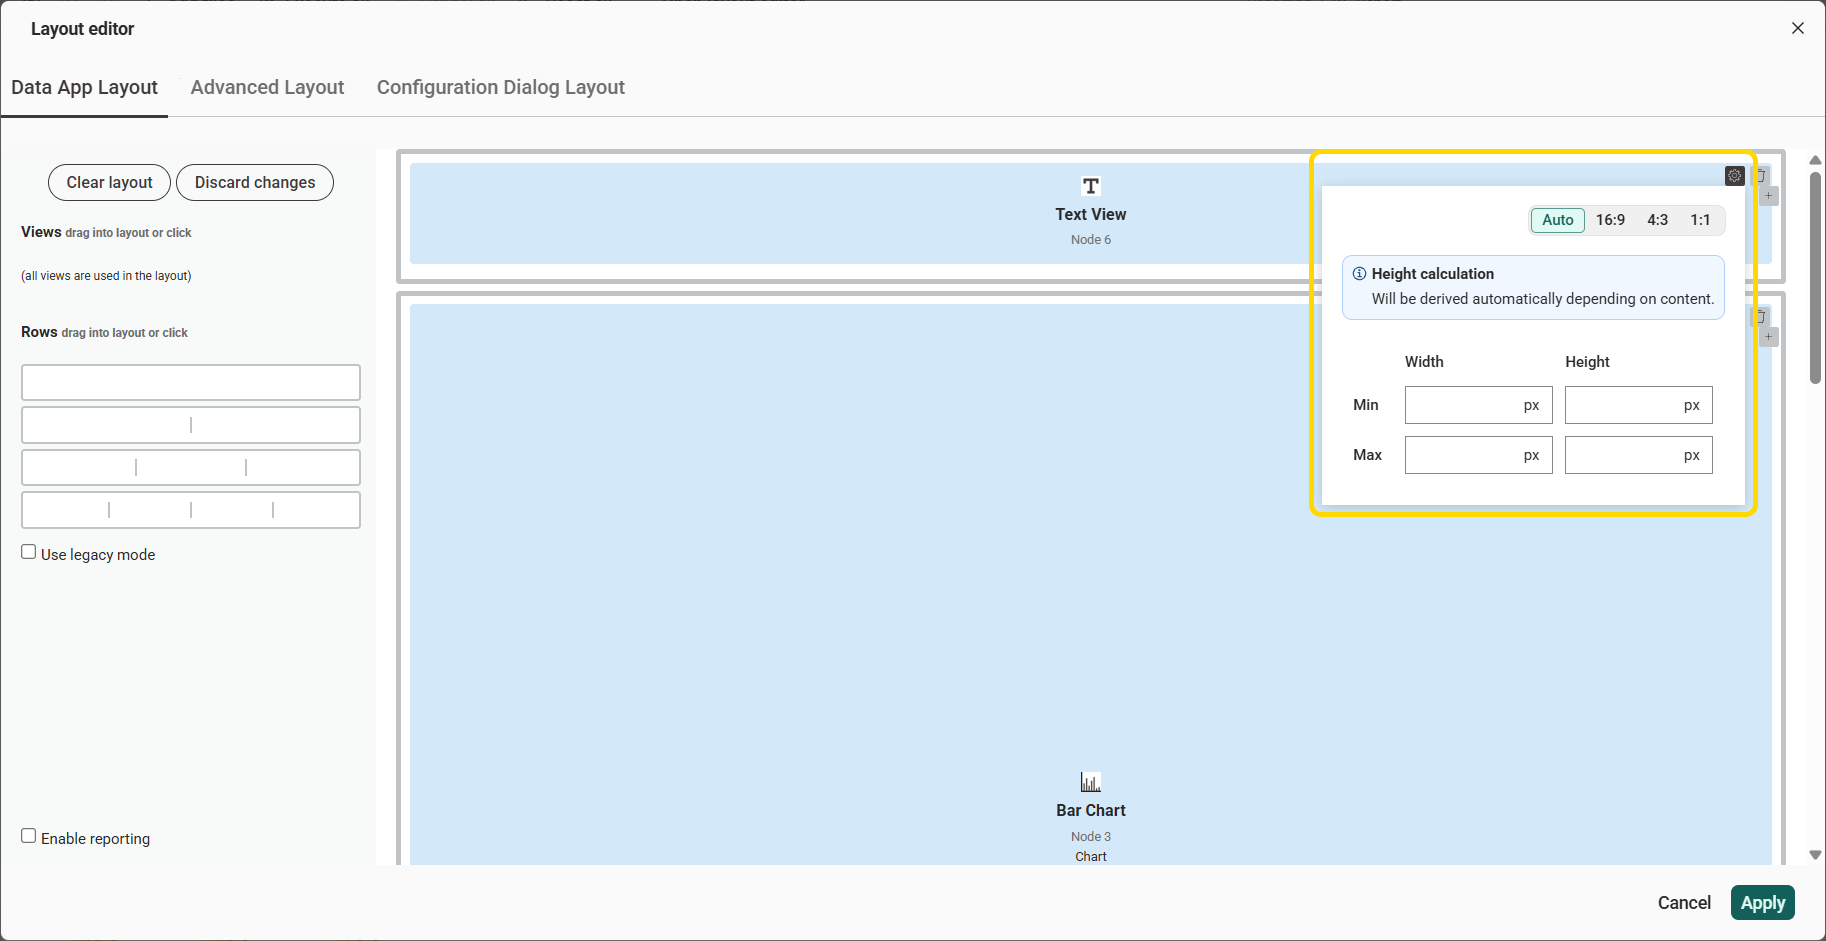
In the layout preview the height of the Text View node is calculated depending on its content, but can be adjusted in the drag and drop grid. Click the cog icon in the upper right corner of the section corresponding to the Text View visualization node:
Enable the reporting function
To enable the component to output the views for a report, tick the Enable Reporting checkbox at the bottom of the layout editor and click Finish:
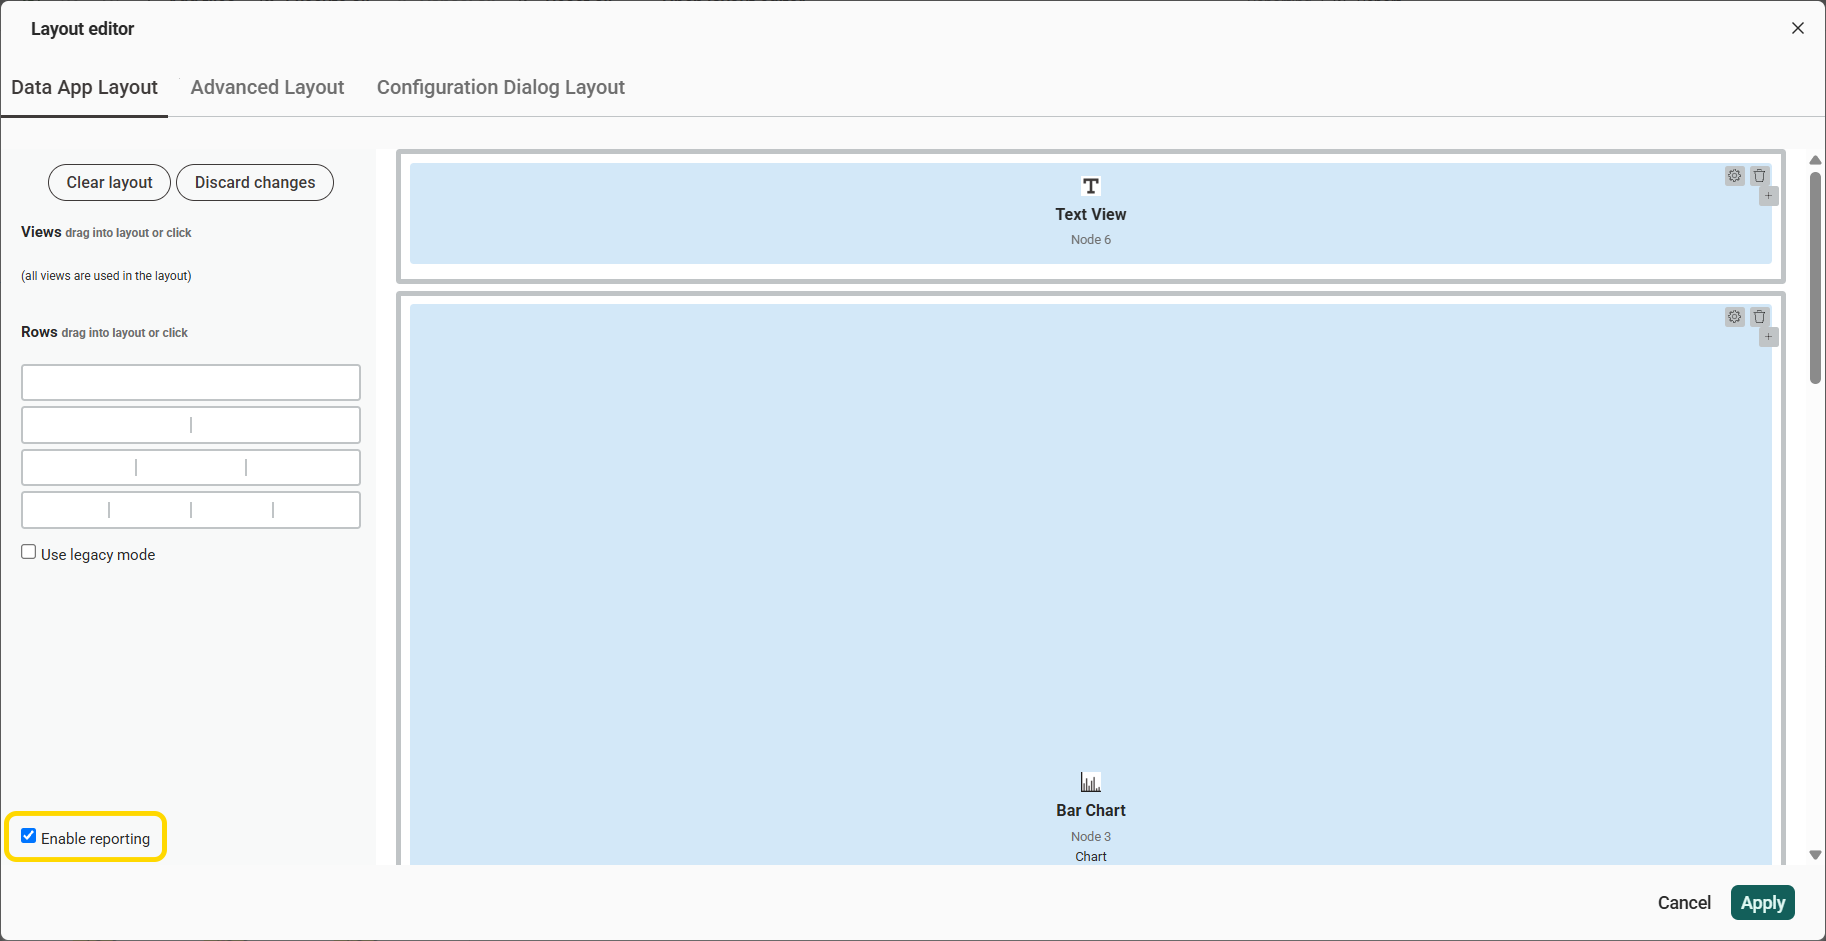
This creates a Report input and a Report output port on your component. They will be visible as blue squares adjacent to the component once you exit it:
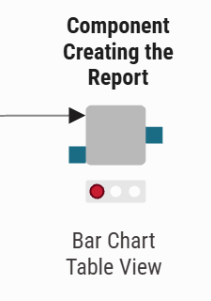
However, before you can execute the component, proceed to Step 3: Customize the template of your report.
Step 3: Customize the template of your report
Before you can connect your component views to a reporting node, you need to customize the page size and orientation using the Report Template Creator node. Add it to your workflow and connect its output port to the existing Report input port on the left side of the component.
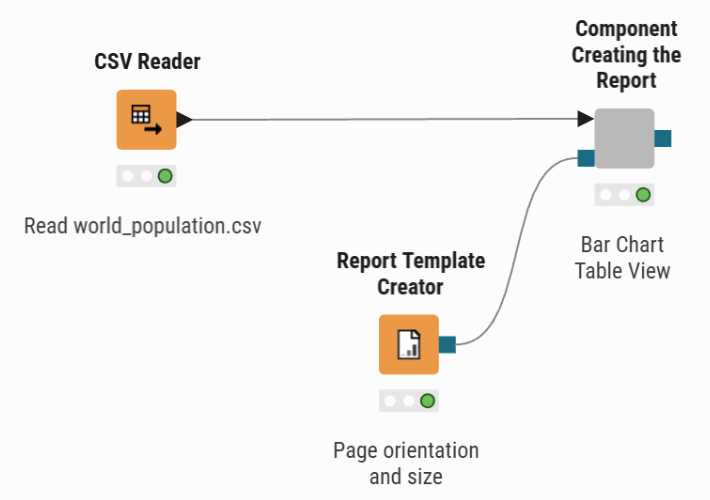
Configure the Report Template Creator node to select the page size and orientation:
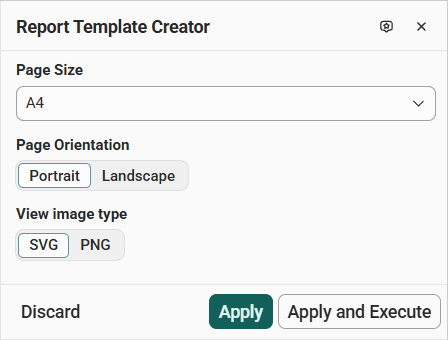
Confirm with Apply and execute the component. Now you can preview the output of the component by executing it and checking the Data app view tab at the bottom of the workflow editor.
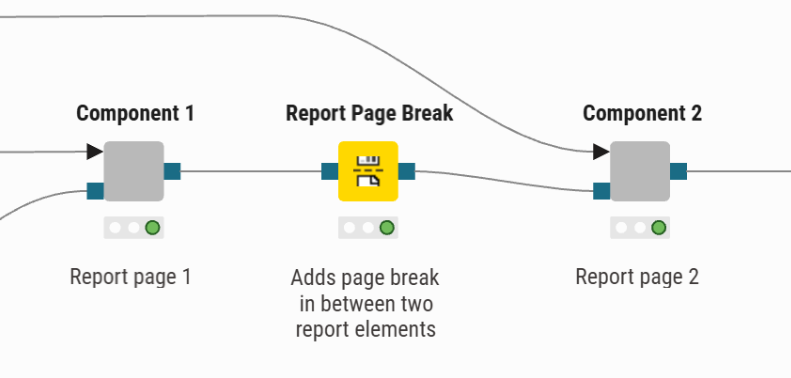
If you want to add a second page to your workflow, use the Report Page Break node. It prevents your views from being cut off at the end of a page in your report file. You can find the Report Page Break node in the node repository. Add it between two components to separate their contents with a page break on the report:
Step 4: Write to file
In order to share the previously created content as a document, you need to save it to a file first. From the Report output port of the component creating the report, you can drag a connection and select compatible writer nodes. You can save your report as either a PDF or HTML file.
Make sure that the Enable Reporting checkbox at the bottom of the component’s layout editor is selected and that a Report Template Creator node is connected to your component, as described in the previous steps. Otherwise, you cannot write the report to a file.
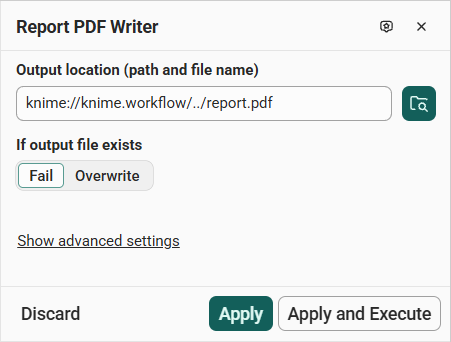
To save your report as a .pdf file, add the PDF Writer node to your workflow. This node allows you to write your report to a PDF file in a specified output location. By default, this is your current space and working folder, with the filename set to “report.pdf”, as indicated by the filepath below:
(knime://knime.space/your-working-folder/report.pdf)
However, you can change the location and file name by typing directly into the field or by clicking the folder icon to open the file browser. There you can browse to a location on the Knime Community Hub, choose Embedded data to store the file directly inside the workflow, or provide a URL, and pick whether the path should be relative to the space or to the workflow. Once you execute the node, it saves the file to the specified location. If you make any changes to the workflow and want to overwrite the existing file, change the If output file exists setting from the default Fail to Overwrite:
To access the PDF file, navigate to your Knime space and working folder in the explorer.
To save your report as an HTML file, follow the same steps as before, but instead of adding the Report PDF Writer node, use the Report HTML Writer node.
Share your report
Once your report is finished you have the option to share it with others. For example, you can send it by email, as shown in this example workflow on the Knime Hub.
For an overview of the extension, example workflows, and other resources, visit the collection page on the Knime Hub.