
Your first workflow
Knime is a single cloud platform where you build data workflows in your browser, then execute, deploy, and share them in the same place. In this tutorial, you read spreadsheet data, filter out a column, combine two sheets, visualize the result, and optionally look up and aggregate values. It assumes no prior knowledge or experience with Knime, so every step is spelled out from the beginning.
Before you begin
To follow this tutorial, you need:
- A Knime account and a space where you can create and edit workflows. Nothing is installed on your computer, so you work entirely in your browser.
- The example data for this tutorial. Download Rooms.xlsx and keep it somewhere you can find it, because you upload it to your space in the first step.
The whole tutorial takes about ten minutes.
Step 1: Add your data
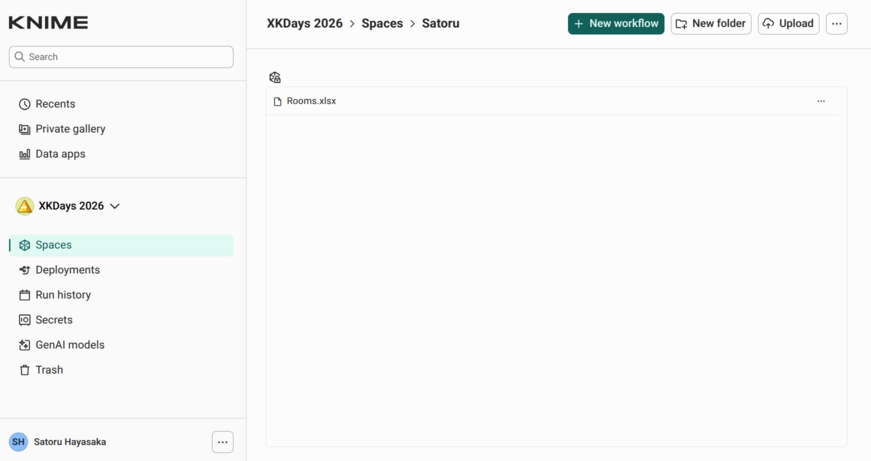
First, log in to your Knime account and open your space. To upload the data file:
- Click Upload in the upper-right corner of your space.
- Select Rooms.xlsx, the file you downloaded earlier.
The file now appears in your space, ready to use in any workflow you build there.
Step 2: Create a workflow
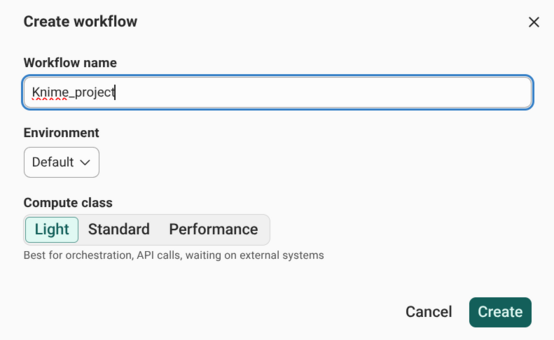
In your space, click New workflow. A dialog to create a workflow opens. Under Workflow name, enter Knime_project and click Create. The workflow editor opens, ready for you to build your workflow.
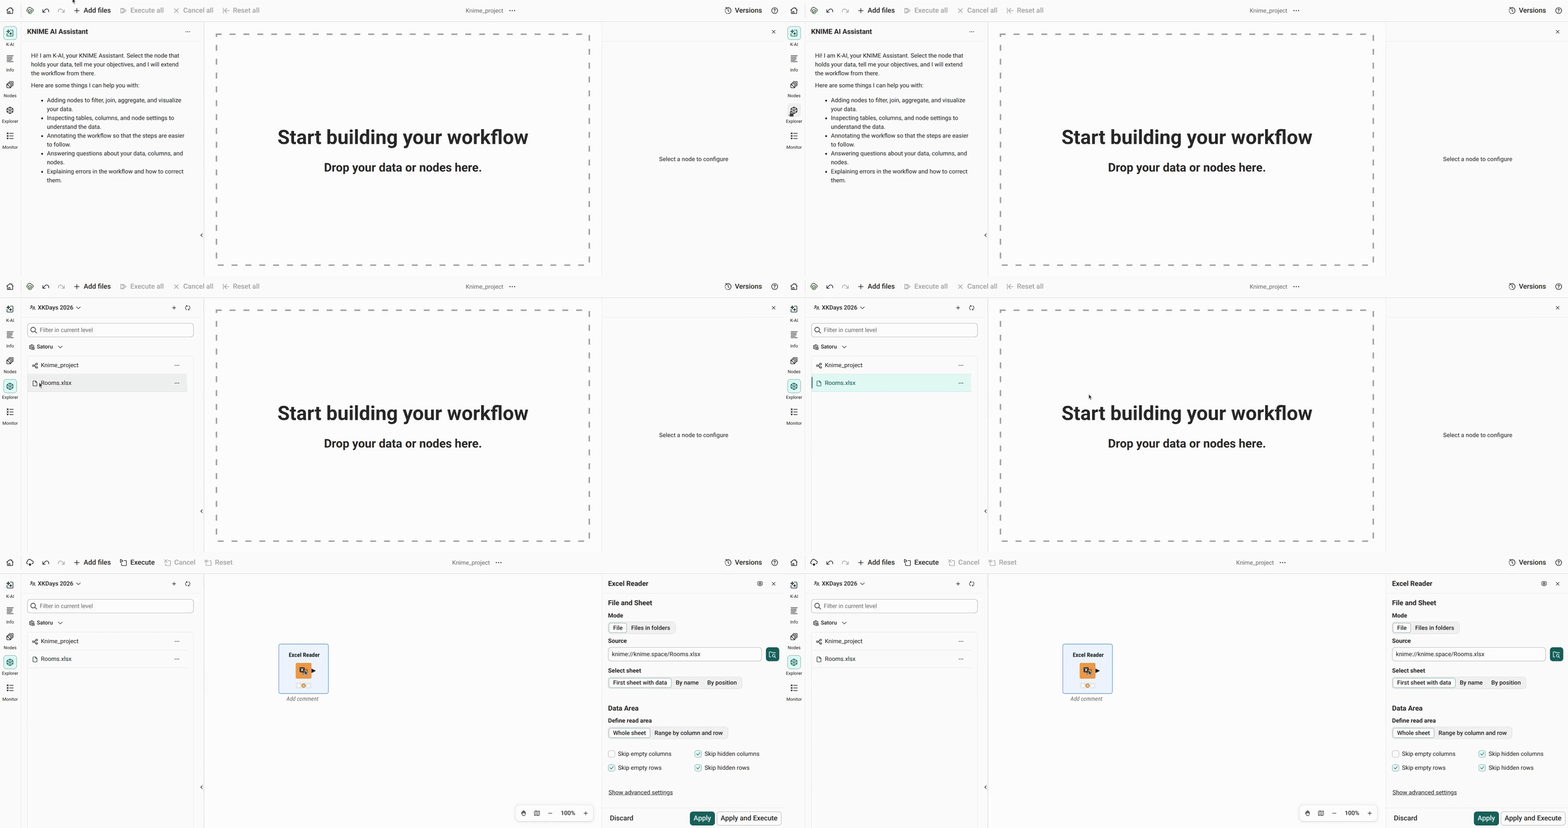
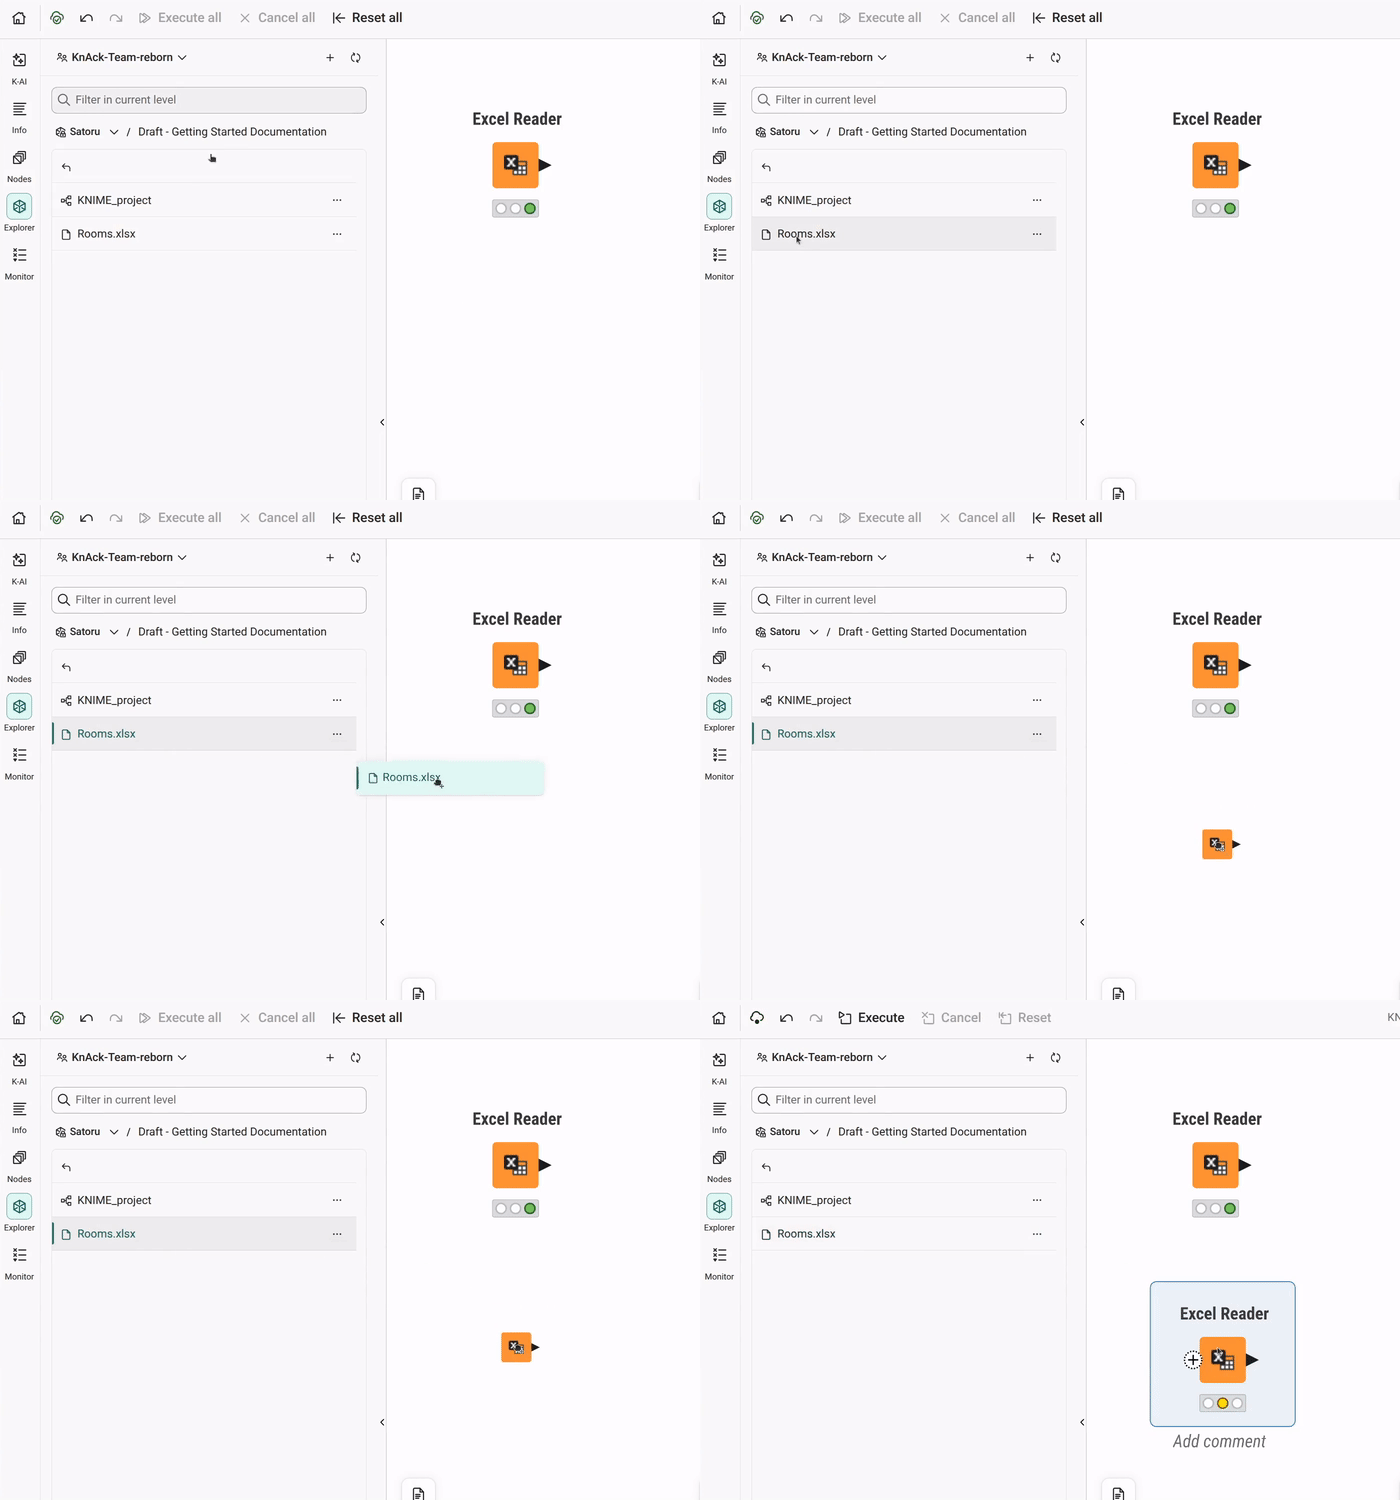
Click the Explorer tab on the left to see the content of your space. Rooms.xlsx is listed there along with your workflow Knime_project. Drag Rooms.xlsx from the Explorer tab to the workflow editor, where you see the message "Start building your workflow". This adds an Excel Reader node to the workflow, already configured to read the file.
Hover the mouse cursor over the Excel Reader node and that reveals buttons in the node action bar above the node. Click the play button on the left. The node is executed and the data are read from the file. You can see the resulting data table on the node monitor below the workflow editor, showcasing the content of the data. In the data table, you see two columns: Item listing furniture items, and Amount showing their quantities.
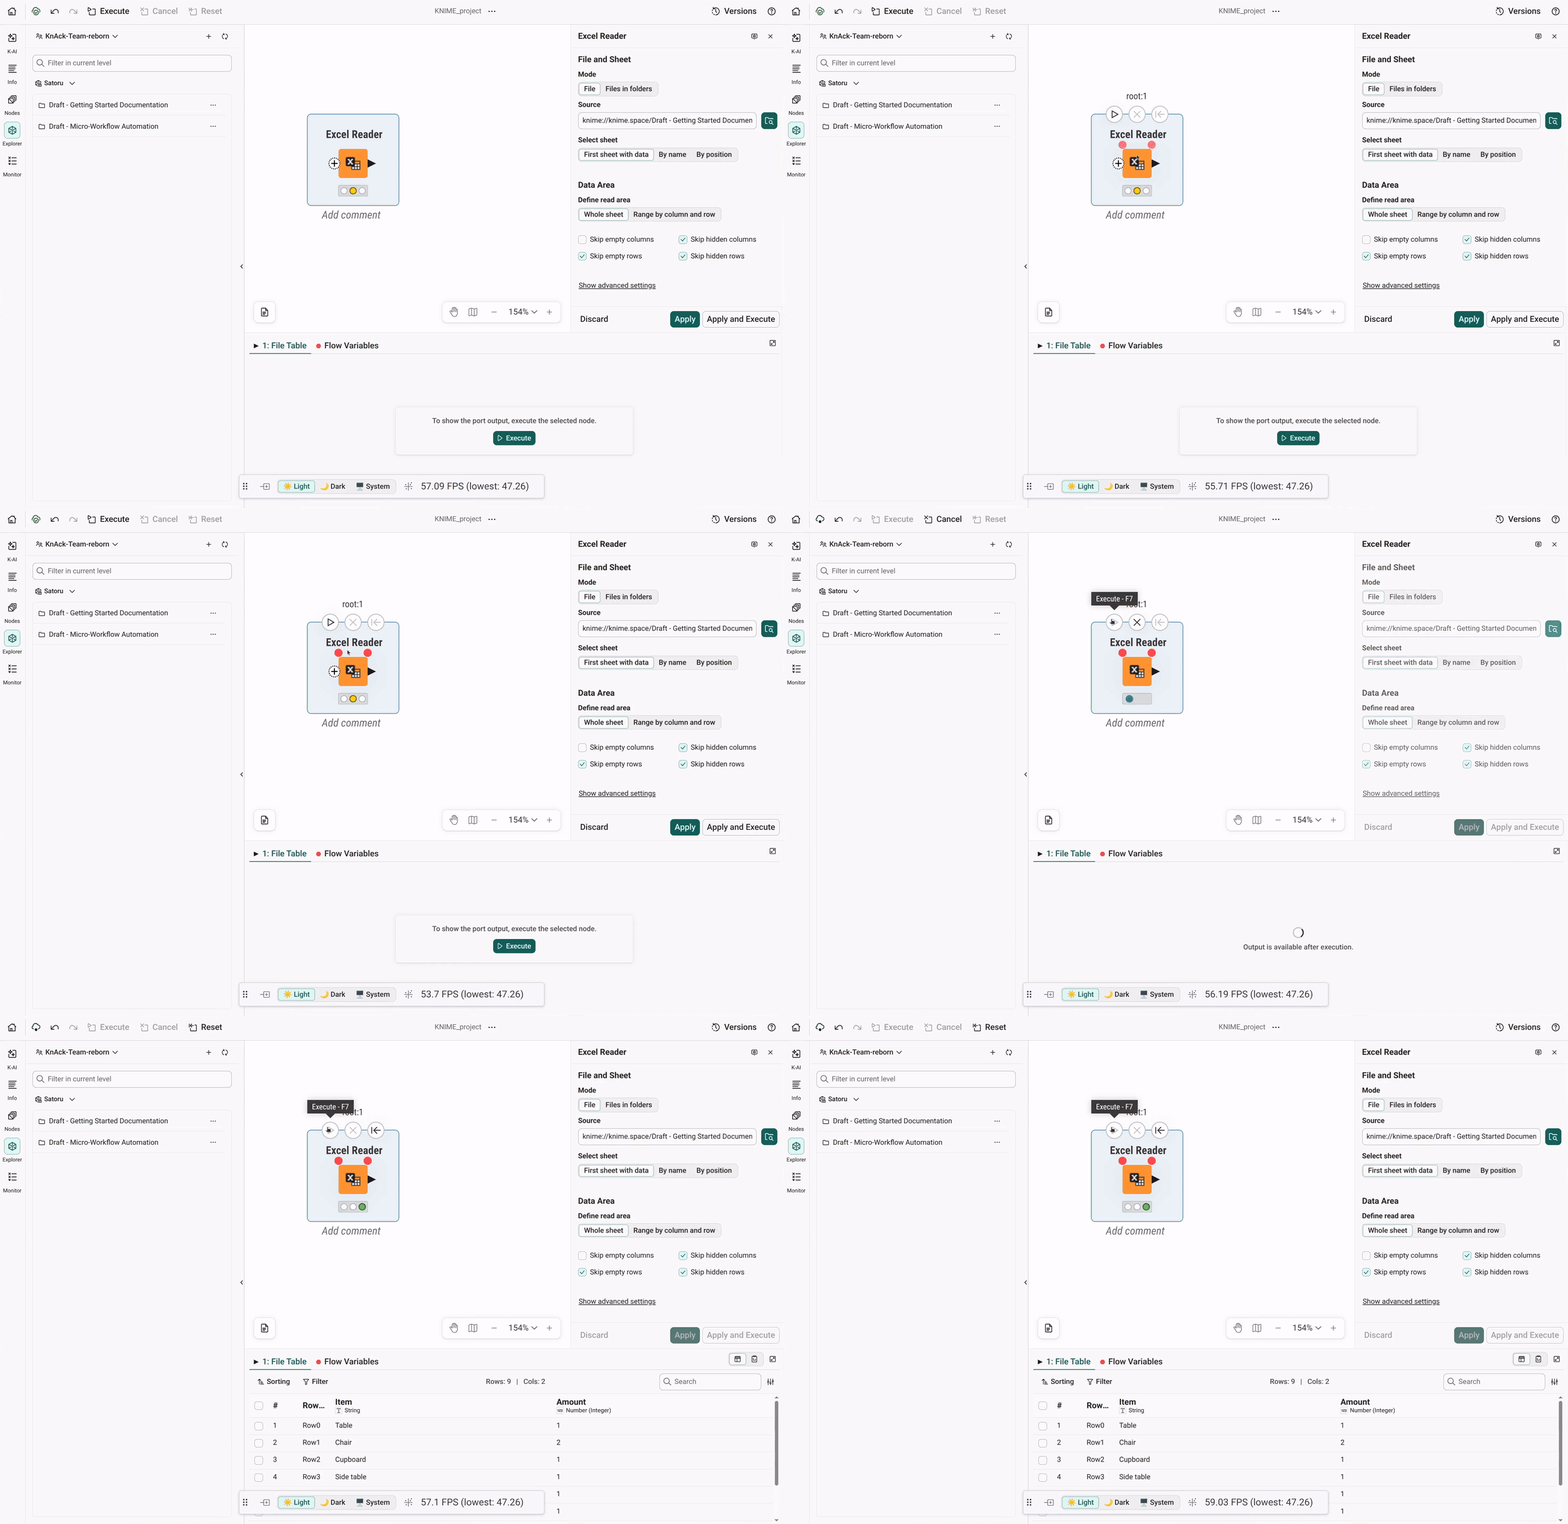
Under the Excel reader node, you may notice there is a traffic light. Before the node was executed, it was yellow, signifying that the node is configured and ready to be executed. After execution, the light became green, indicating that the node was successfully executed.
Step 3: Filter out a column you don't need
The data you read in the previous step comes from the first sheet Kitchen. You also want to read the data from the second sheet Living room. To do so, you need another Excel Reader node to read the data from a different sheet.
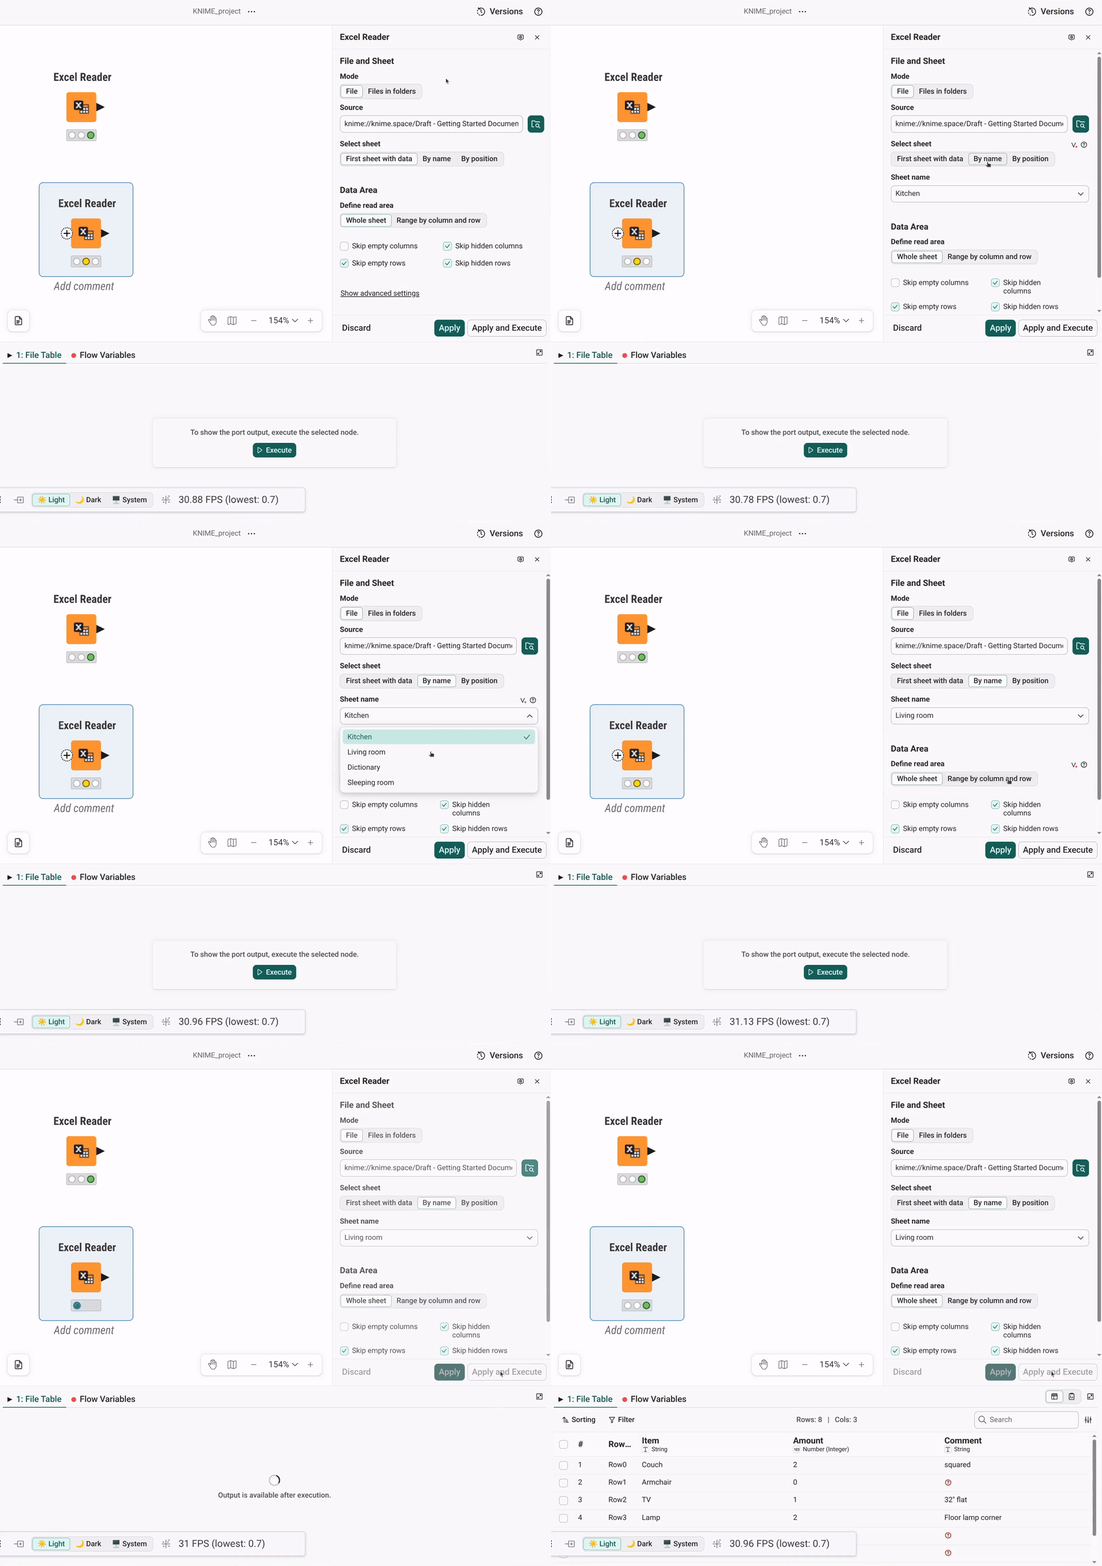
To add the second Excel Reader node, drag and drop Rooms.xlsx file from your space under the Explorer tab to the workflow editor, just under the first Excel Reader node. This adds the second Excel Reader node to the workflow.
Next you specify the sheet to read. On the configuration panel on the right, under Select sheet, under the By name tab, you specify Living room from the pulldown menu for sheet. Execute this node by clicking the Apply and Execute button, and you can see the data in the node monitor below. You may notice that the two of the columns, Item and Amount are the same as the first data, this data table also contains an additional column Comment.
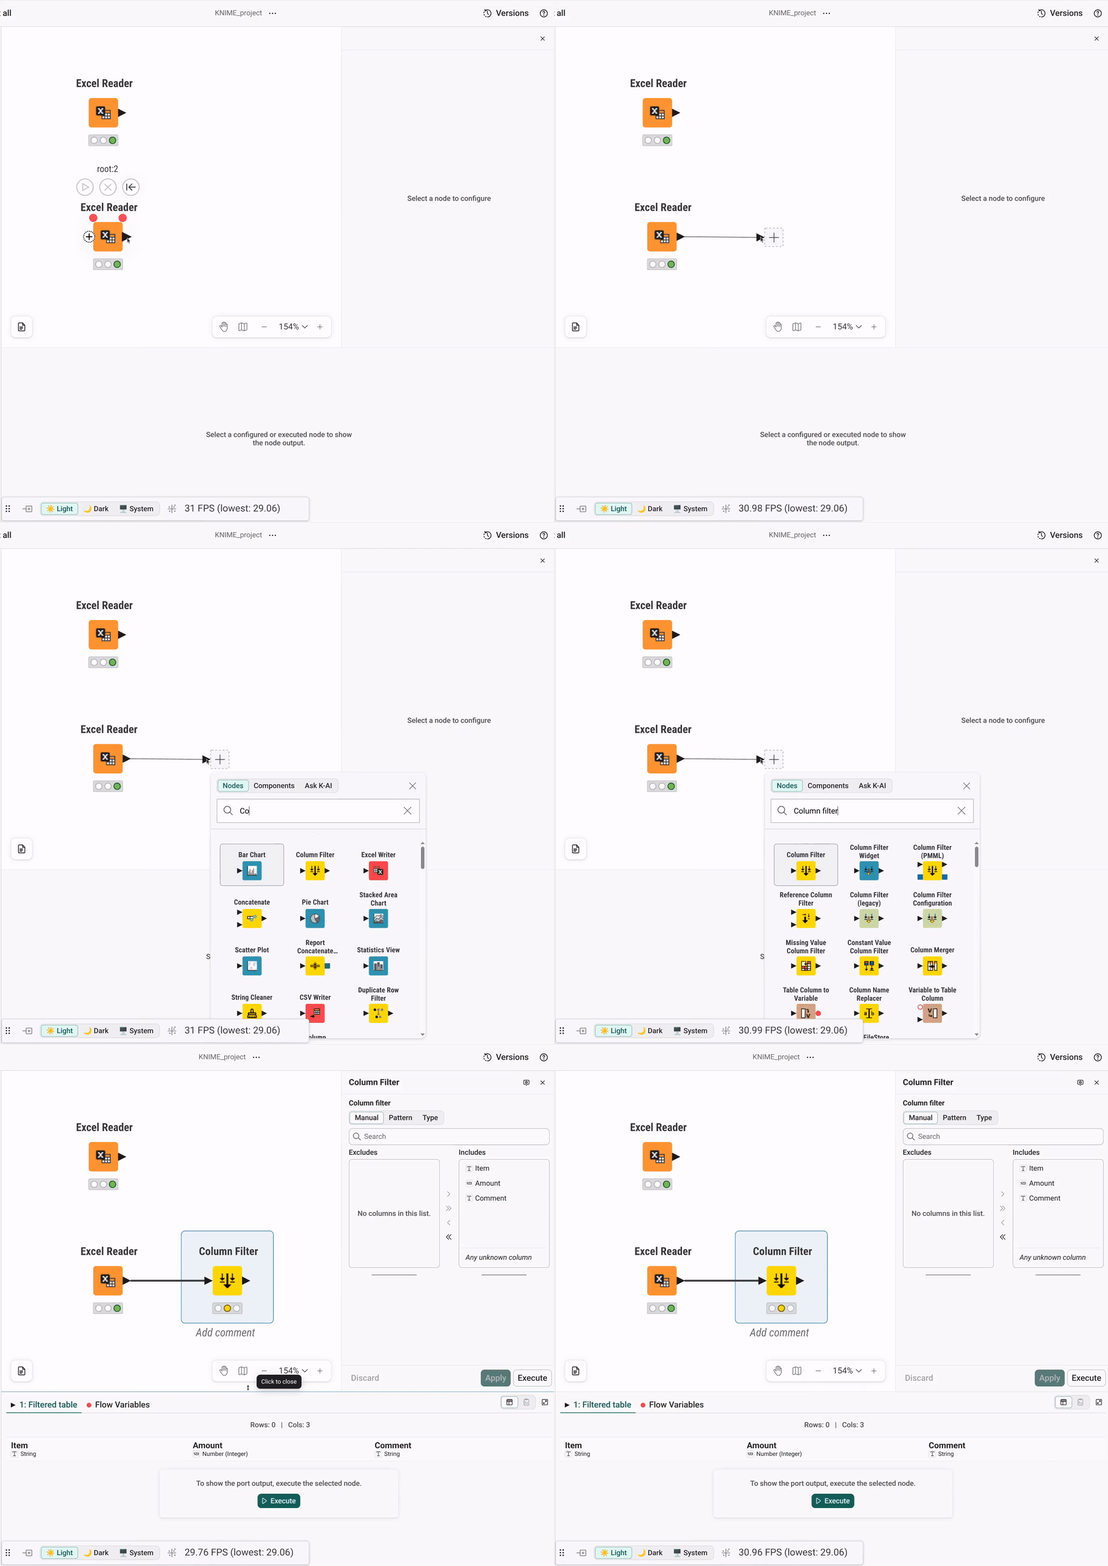
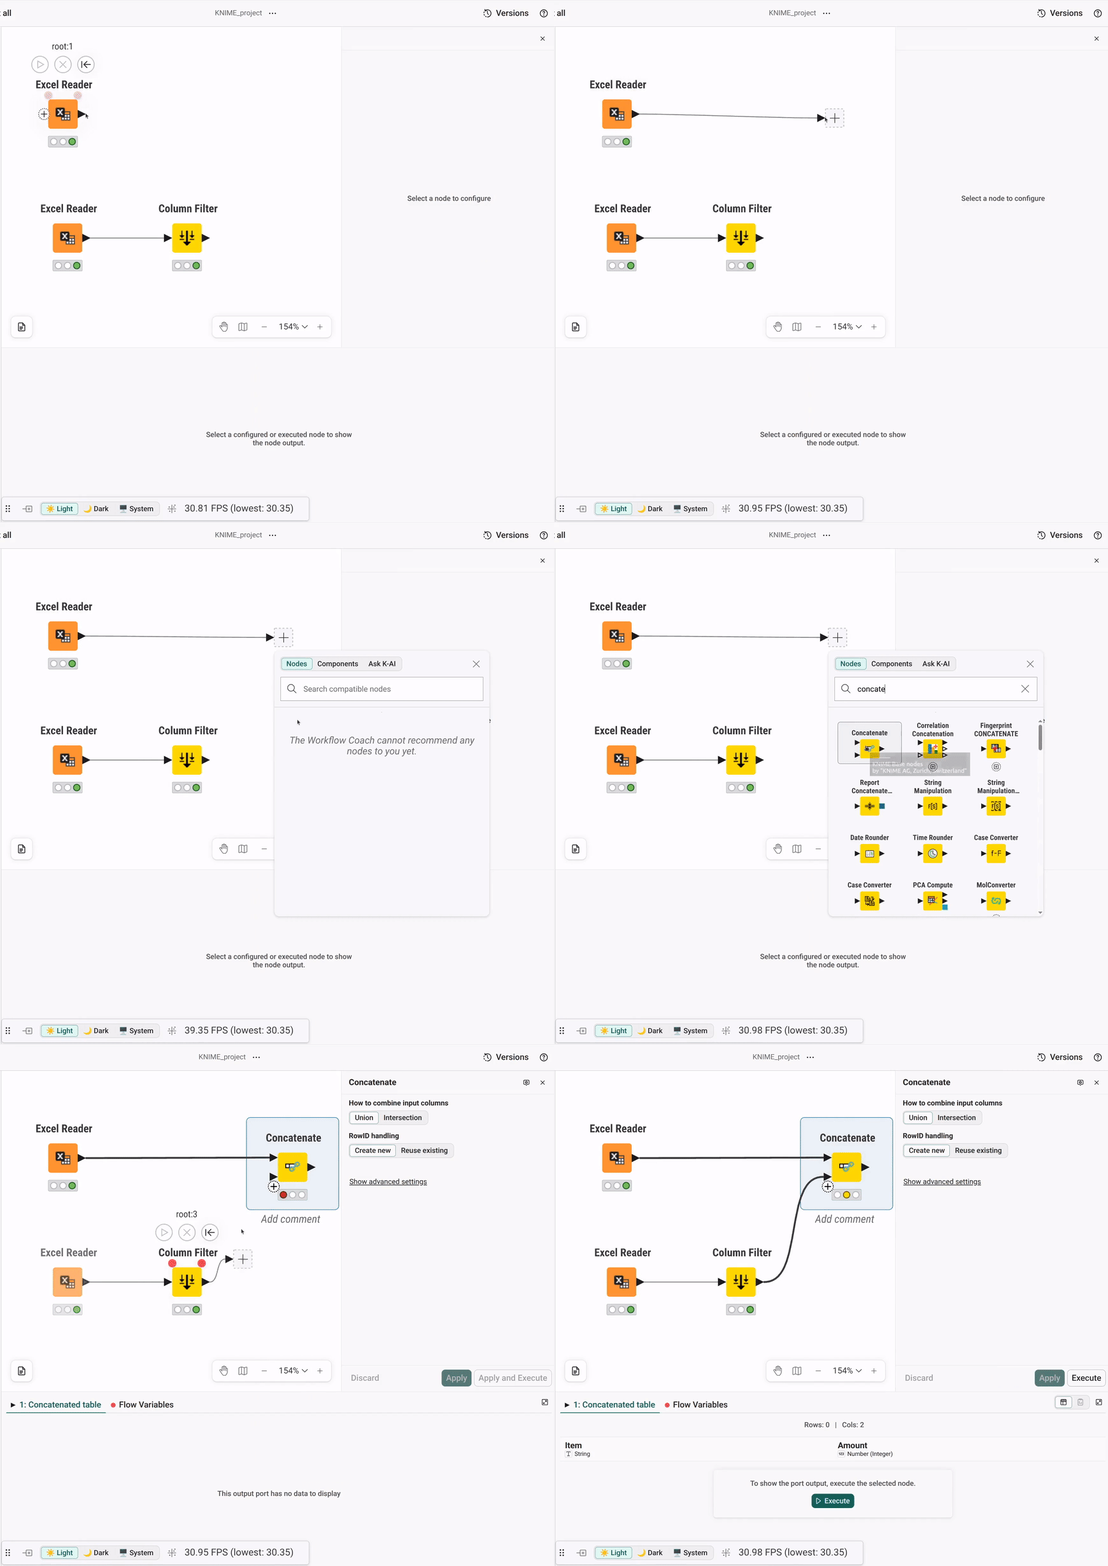
We want to filter out the Comment column from the second data table. To do so, click the output port of the Excel Reader node, the black triangle on the right, and drag it to the blank workflow editor. This action opens the quick node insertion panel. Type “Column Filter” into the search bar and click on the Column Filter node, as shown below. The arrow connects the output port of the Excel Reader node with the input port of the Column Filter node. That means that the data processed by the Excel Reader node will be passed on to the subsequent Column Filter node.
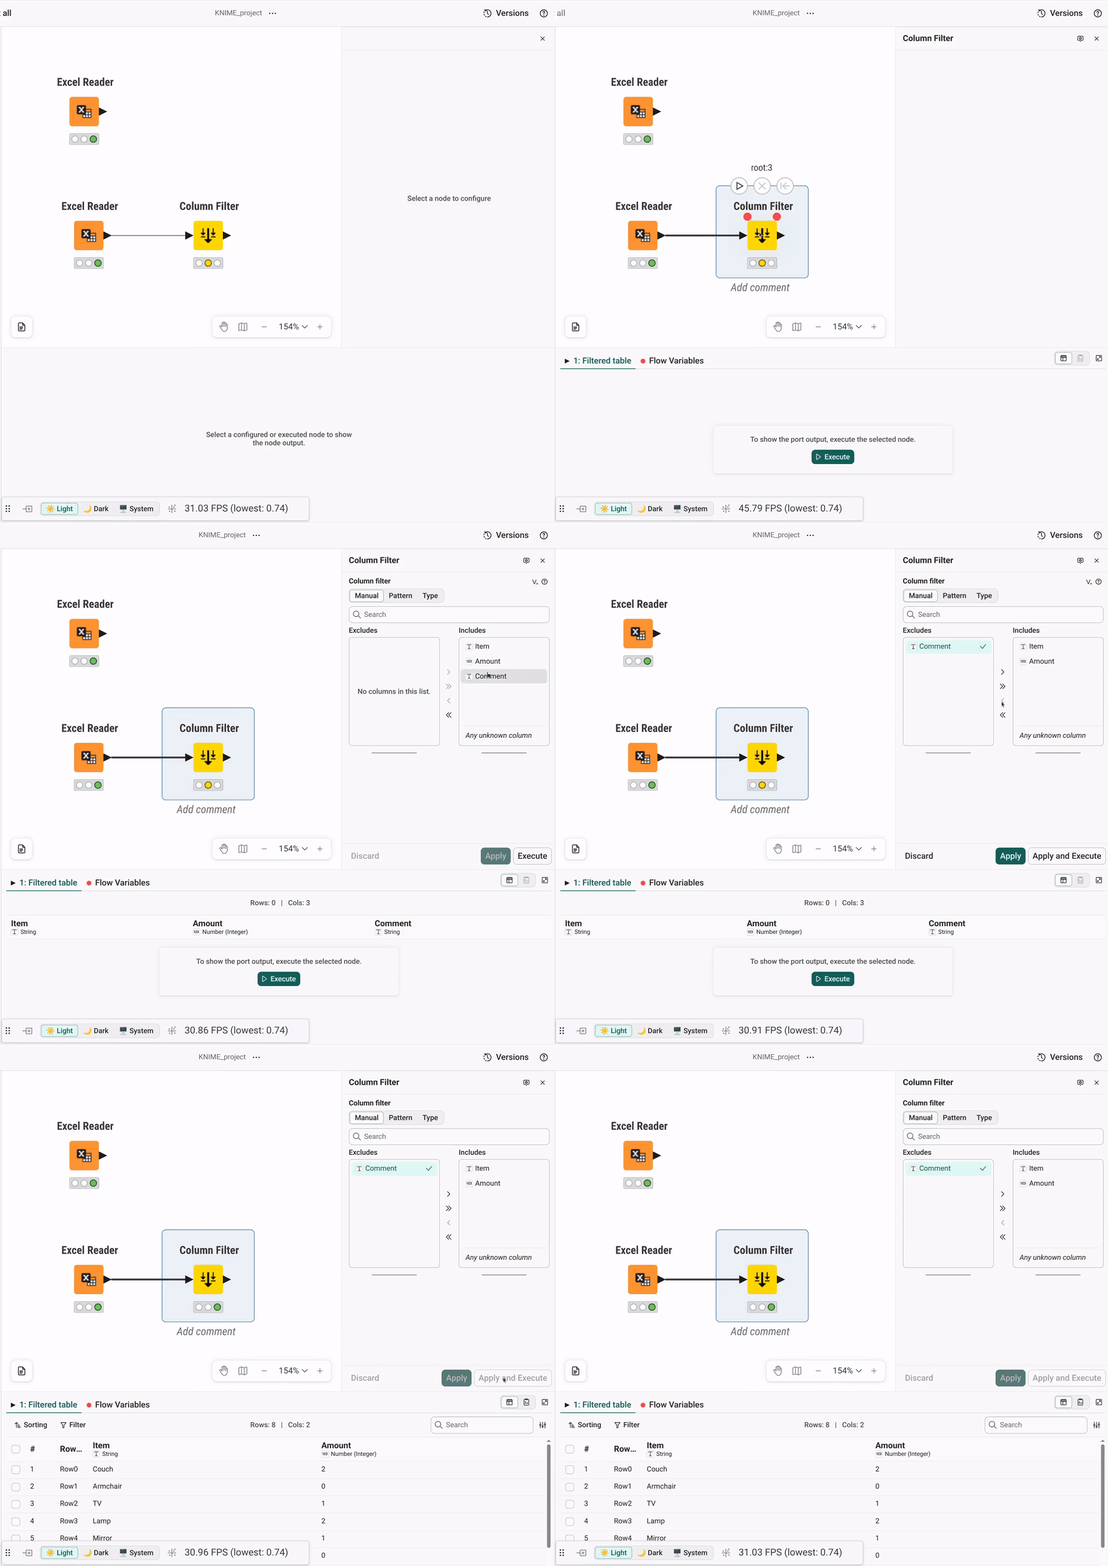
Select the node to show the configuration panel. Here, move the column Comment into the Excludes field by first selecting it from the list and then clicking the single arrow pointing to the left. Click Apply and Execute. Now the filtered data table is available at the output port of the Column Filter node.
Step 4: Combine the two sheets
Now that you have cleaned up the data in the second sheet, you can combine all the data into a single table before proceeding with the next step.
To do so, click the output port of the first Excel Reader node and drag the arrow onto the blank workflow editor. This action opens the quick node insertion panel. Type “Concatenate” into the search bar and click on the Concatenate node, as shown below. Since the data in the first input table did not need to be cleaned, it can serve as direct input for the Concatenate node. The arrow already connects the output port of the Excel reader node with the first input port of the Concatenate node.
Then, connect the second input data table port of the Concatenate node to the output port of the Column Filter, which contains the cleaned-up data from the second Excel Reader node, as shown below.
Step 5: Visualize the result
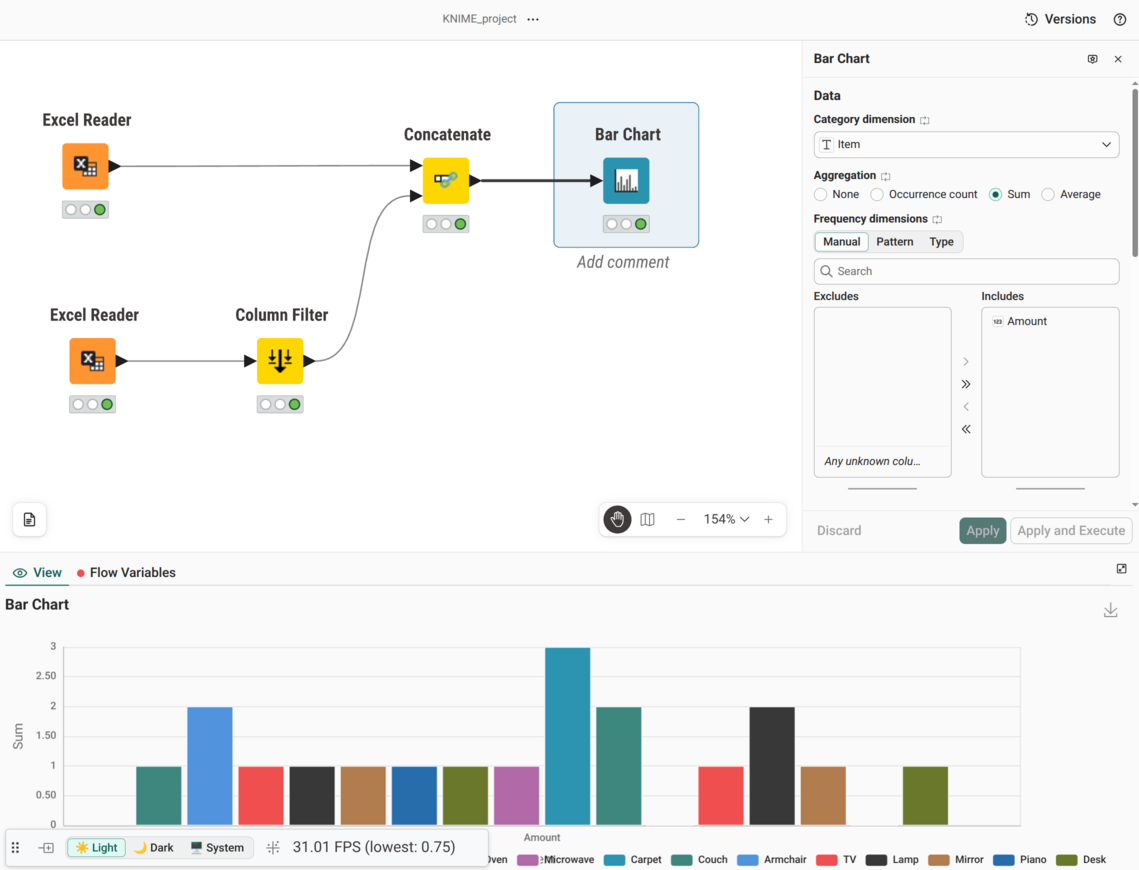
To visualize the data, you need to use the view nodes. As an example, let's generate a bar chart from your data by following these steps. First, drag the arrow from the output port of the Concatenate node. In the resulting quick node insertion panel, type Bar Chart in the search bar and select the Bar Chart node. Next, configure the Bar Chart node in its configuration panel. Select the column Item as the Category dimension, select the Sum as the Aggregation method, and finally include the column Amount as the Frequency dimension of the bars.
Click Apply and execute to see the bar chart in the node monitor.
Step 6 (Optional): Look up and aggregate values
In this optional step, you use the third sheet of the Excel file, Dictionary, to look up the volume of each item and calculate totals.
Prepare the dictionary table
The Dictionary sheet contains three columns:
- Dict-Item: the dictionary keys
- Dict-Volume: the matching volumes, with some values missing
- empty_C: the values missing from Dict-Volume
To read and clean the dictionary table:
Add a third Excel Reader node and configure it to read the Dictionary sheet.
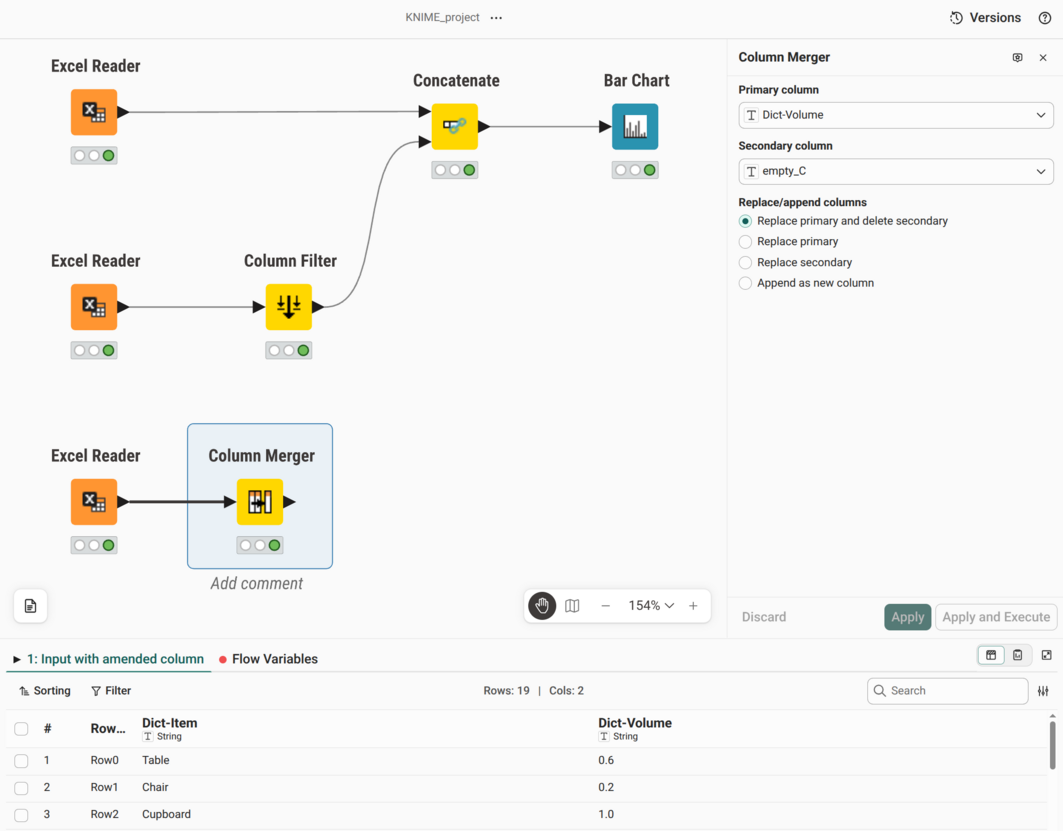
Connect a Column Merger node to the Excel Reader node. In its configuration panel, set Primary column to Dict-Volume and Secondary column to empty_C. Then select the first option to replace the values in the primary column and delete the secondary column.
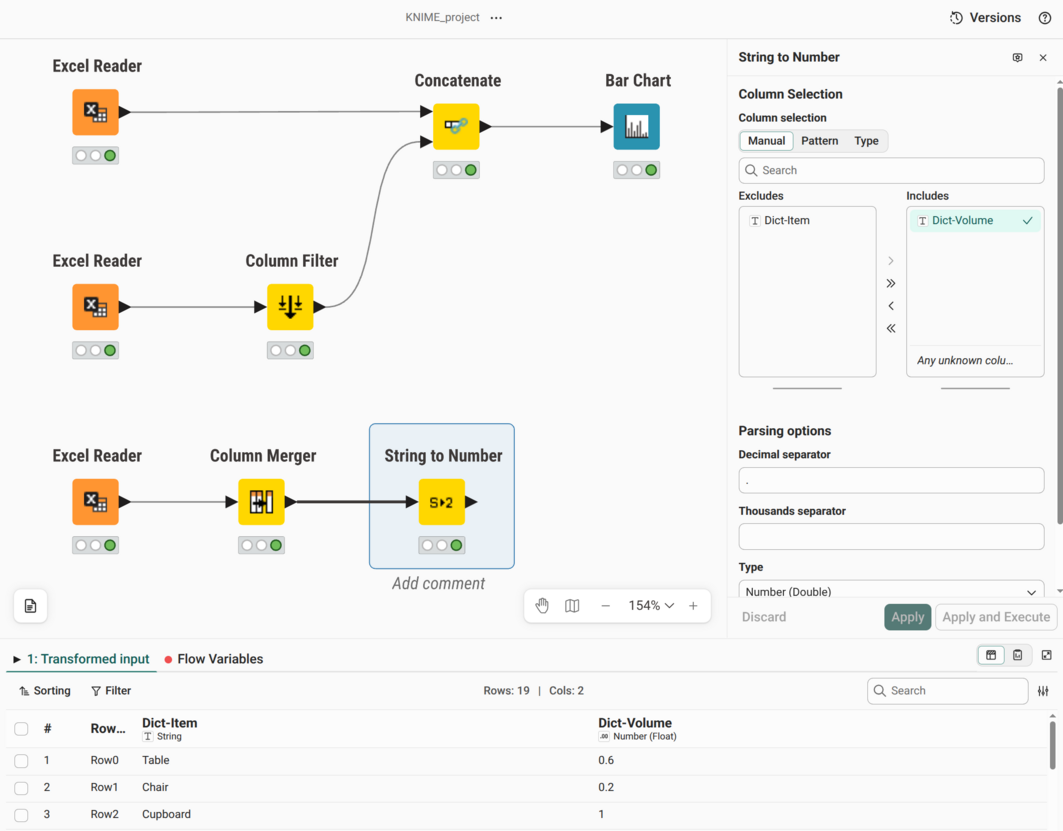
Connect a String to Number node to convert Dict-Volume from string to number. Include Dict-Volume and exclude Dict-Item.
Look up the volume of each item
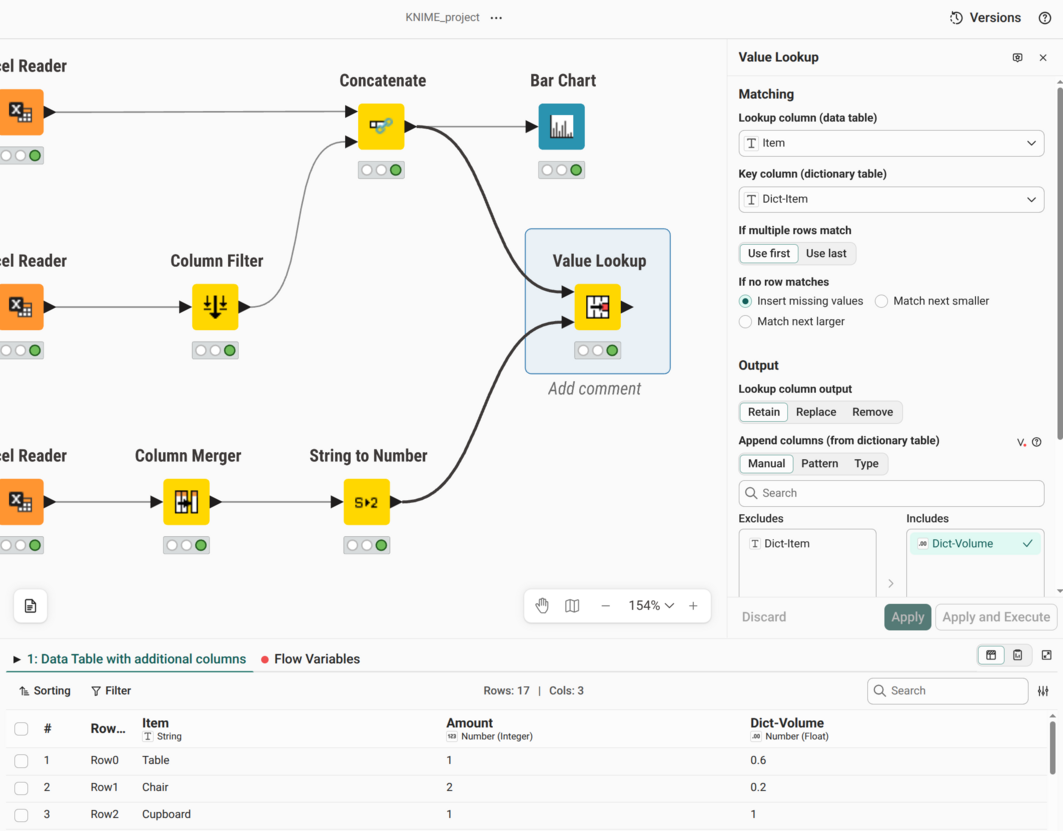
The Value Lookup node adds the matching Dict-Volume value from the dictionary table to each row of the Concatenate output. To set it up:
- Drag from the output port of the Concatenate node and add a Value Lookup node from the quick node insertion panel. Its first input port connects to the Concatenate node automatically.
- Connect the second input port of the Value Lookup node to the output port of the String to Number node.
- In the configuration panel, set the following options:
- Lookup column: Item
- Key column: Dict-Item
- Output: include Dict-Volume and exclude Dict-Item, because the output already contains Item
- Click Apply and Execute.
Calculate the total volumes
The Row Aggregator node aggregates columns with an aggregation function. Its first output port contains the aggregation results, and its second output port contains the grand total. To calculate the totals:
- Drag from the output port of the Value Lookup node and add a Row Aggregator node.
- In the configuration panel, set the following options:
- Category column: Item
- Aggregation: Sum
- Aggregation columns: include Dict-Volume and exclude Amount
- Weight column: Amount
- Select Additional 'grand totals' at the second output port.
- Click Apply and Execute.
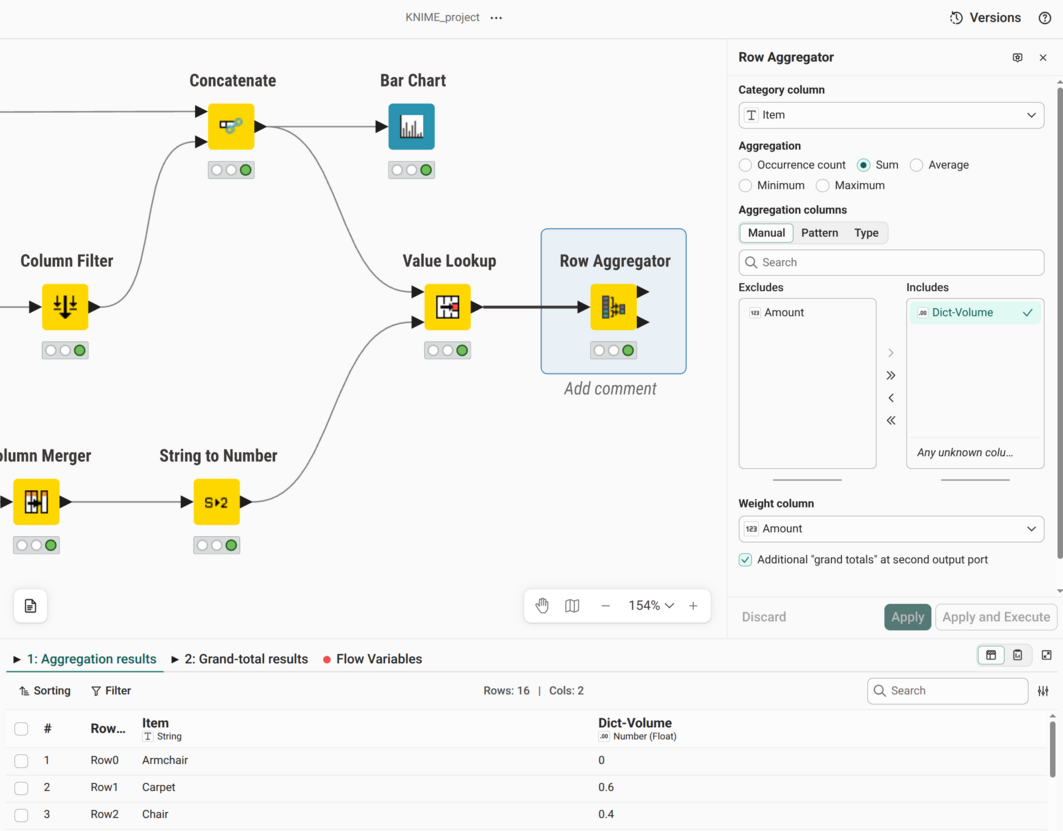
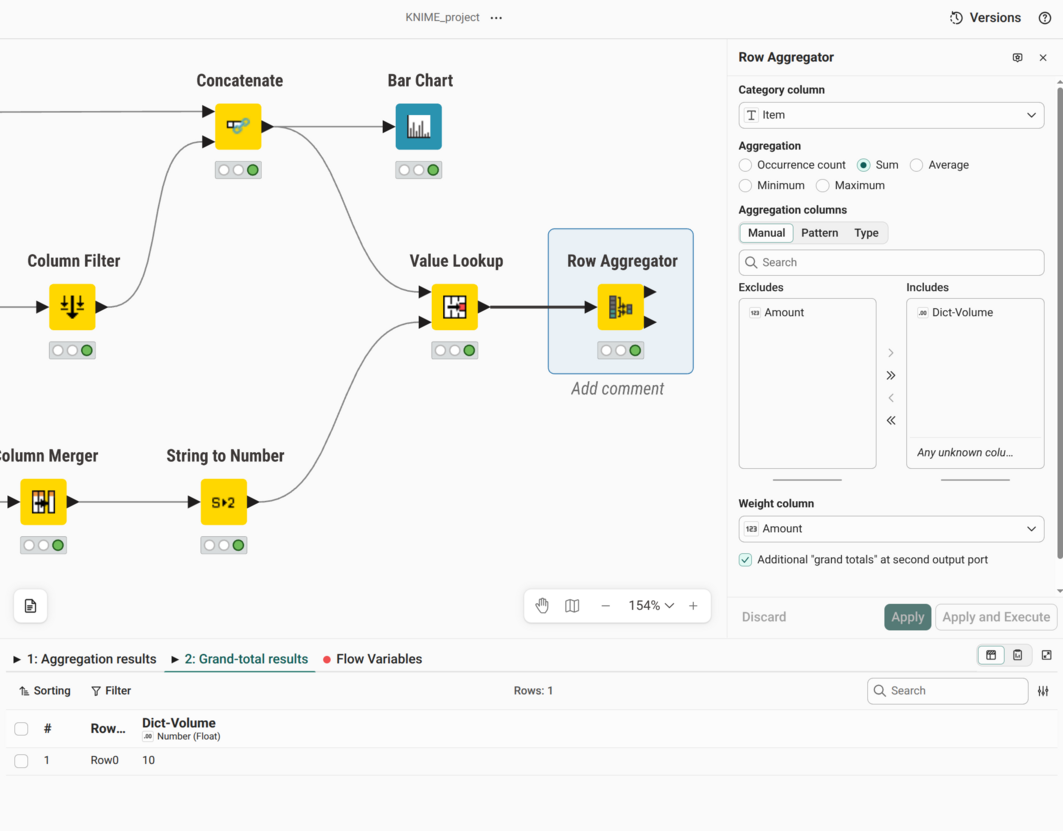
In the node monitor, the 1: Aggregation results tab lists each distinct item with its total volume. The 2: Grand total results tab shows the grand total volume of all items.
Summary
You built a complete workflow in your browser, from raw spreadsheet to finished chart. You read two sheets of an Excel file and filtered out the column you did not need. You then combined both tables into one and displayed the result as a bar chart. In the optional last step, you looked up each item's volume in a dictionary sheet and calculated the totals. Every node you added follows the same pattern: connect it to an output port, configure it in the configuration panel, and execute it to see the result in the node monitor.
Next steps
- Your first deployment: run your workflow manually and on a schedule
- Nodes and workflows: learn the concepts behind the workflow you built
- Integrations: connect your workflows to other tools and data sources