
Deploy your first data app
In this tutorial, you build a simple workflow, publish it as a data app, and open it in the browser. By the end, you have a working app that reads the list of sheets in an Excel file, lets you choose a sheet, and displays its contents.
What you need
- A Knime account (any plan)
- An environment in your space
- A blank workflow in your Knime space
- The example data for this tutorial, Rooms.xlsx
Step 1 — Add a Value Selection Widget
The Value Selection Widget lets the person running the app choose which sheet of Rooms.xlsx to display. To fill the widget with choices, you first read the list of sheets from the file.
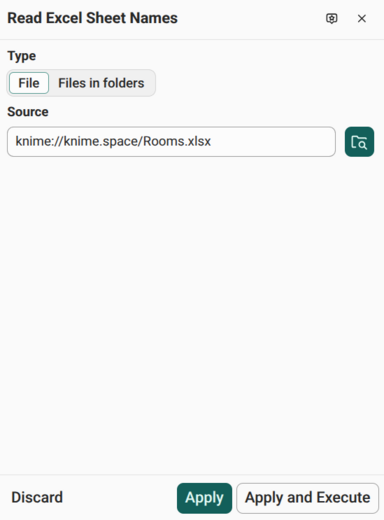
In the node repository, search for Read Excel Sheet Names, then drag and drop the node onto the workflow editor. In the configuration panel of the node, click the folder icon next to Source. In the panel that opens, select Rooms.xlsx, then click Choose file.
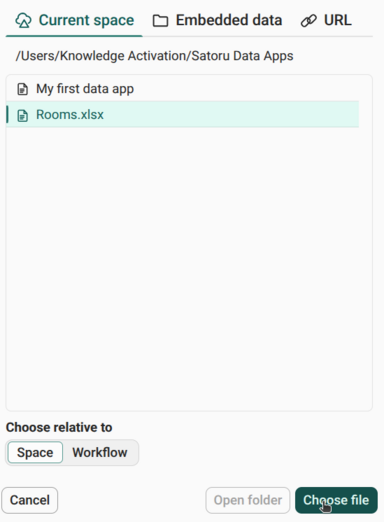
In the configuration panel, click Apply and Execute.
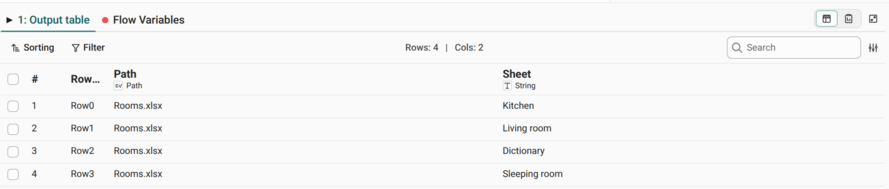
The node outputs a table with a Sheet column that lists all sheets in Rooms.xlsx.
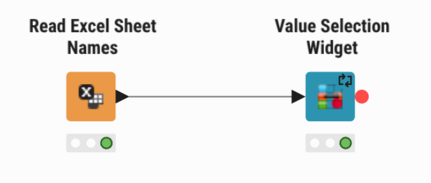
Search for Value Selection Widget, then drag and drop it to the right of the Read Excel Sheet Names node. Connect the output port of the Read Excel Sheet Names node to the input port of the Value Selection Widget.
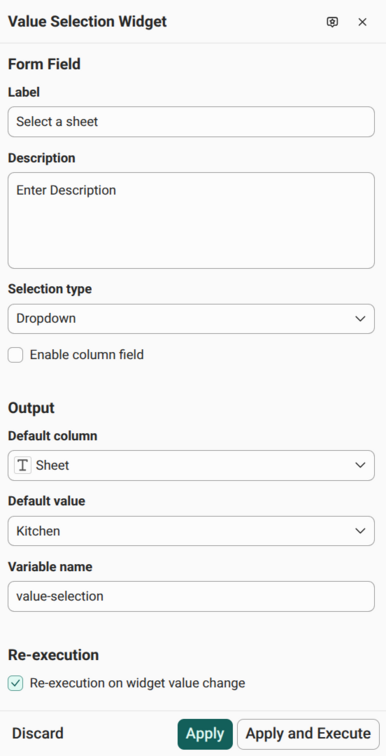
Select the Value Selection Widget to open its configuration panel. Configure the following settings:
- Label: Enter
Select a sheet - Selection type: Select Dropdown
- Enable column field: Clear the checkbox
- Default column: Select Sheet
- Default value: Select Kitchen
- Variable name: Enter
value-selection - Re-execution on widget value change: Select the checkbox
Then click Apply and Execute.
- Label: Enter
The Value Selection Widget outputs the selected sheet name as a flow variable. Here is the workflow so far:
Step 2 — Add an Excel Reader
The Excel Reader reads Rooms.xlsx. The flow variable value-selection from the Value Selection Widget controls which sheet it reads.
Add an Excel Reader node to the right of the Value Selection Widget.
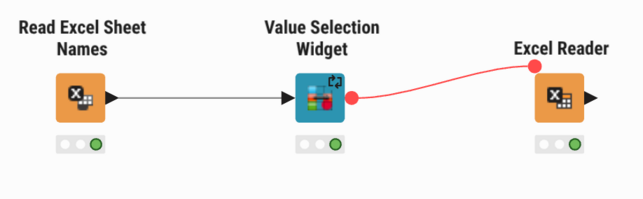
Connect the flow variable output port of the Value Selection Widget to the flow variable input port of the Excel Reader. The flow variable input port is on the top left of the Excel Reader node. It's hidden until you hover over the node.
Select the Excel Reader to open its configuration panel, then configure it:
- Click the folder icon next to Source. In the panel that opens, select Rooms.xlsx, then click Choose file.
- Under Select sheet, select By name.
- Hover over the right side of the Sheet name box, then click the flow variable icon that appears.
- In the Overwrite with flow variable panel, select value-selection.
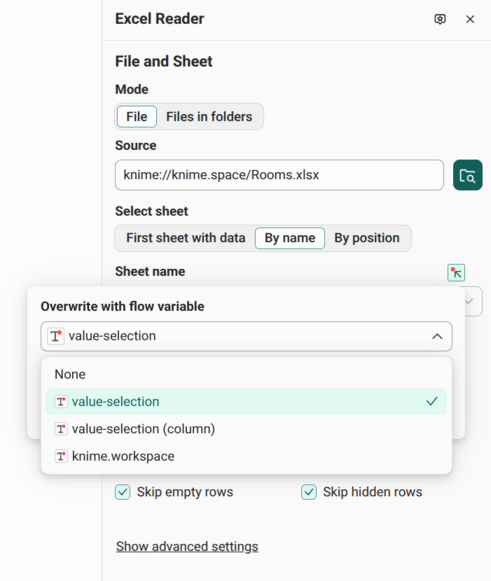
The Sheet name box is now grayed out because the flow variable controls its value. Click Apply and Execute.
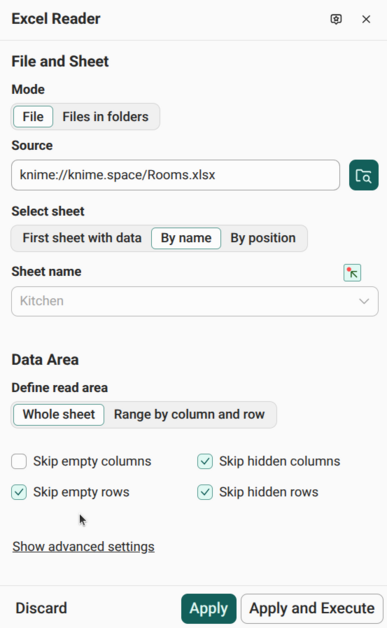
The Excel Reader now reads whichever sheet the app user selects. Here is the workflow so far:
Step 3 — Add a Table View
The Table View displays the sheet that the Excel Reader reads.
Search for Table View in the node repository, then drag and drop it to the right of the Excel Reader.
Connect the output port of the Excel Reader to the input port of the Table View.
Select the Table View to open its configuration panel. Click the >> button to move all columns to the Includes box. The Includes box now lists Any unknown column, so the Table View displays all columns, even if different sheets have different columns.
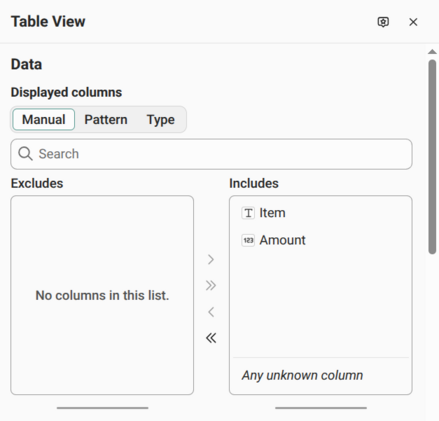
Click Apply and Execute. The node monitor displays the table view.
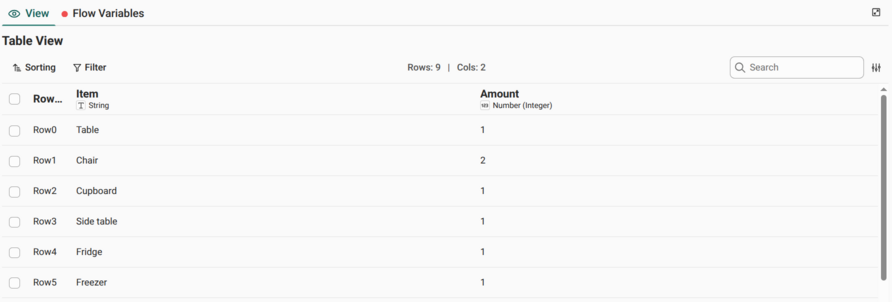
The table view looks like a regular data table in the node monitor. The difference is that you can include a Table View in the data app that you create in the following steps.
Here is the workflow so far:
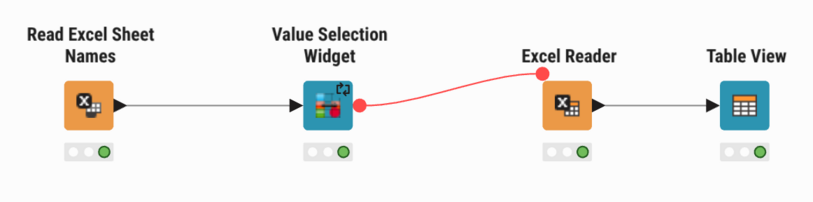
Step 4 — Create a component
A data app displays the views of the widgets and view nodes inside a component. Wrap all four nodes in a component to combine their views into a single page.
- Select all four nodes in the workflow editor.
- Right-click one of the selected nodes and select Create component. A dialog tells you that creating the component resets the executed nodes. Click Confirm.
- The component name is selected for editing. Type a name, for example
Sheet viewer, then press Enter. - Click the play button above the component. When the component finishes executing, the Data app view tab shows the Value Selection Widget and the Table View combined into a single view.
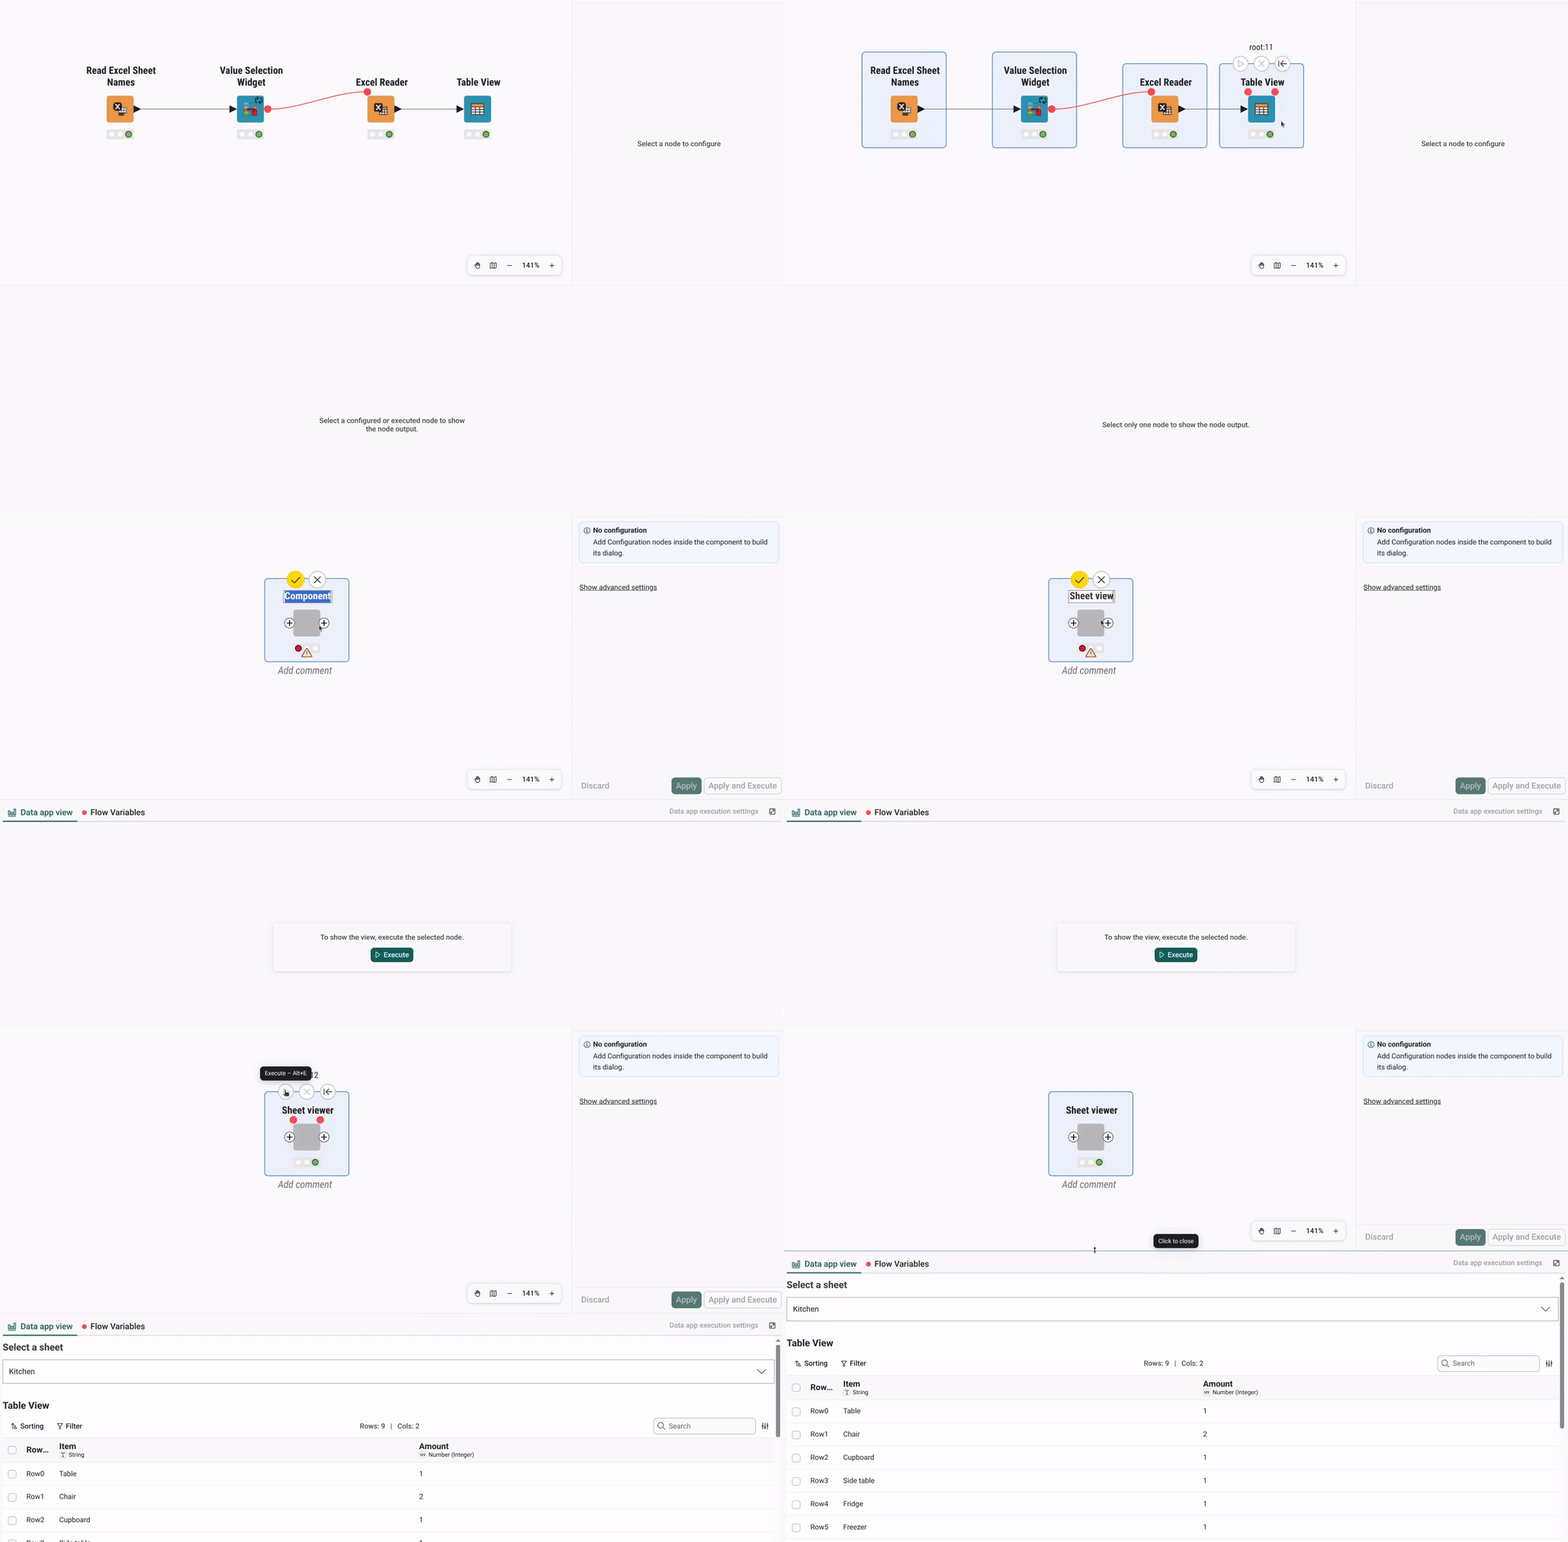
Select a different sheet from the Select a sheet dropdown menu. The table updates to show the contents of the selected sheet.
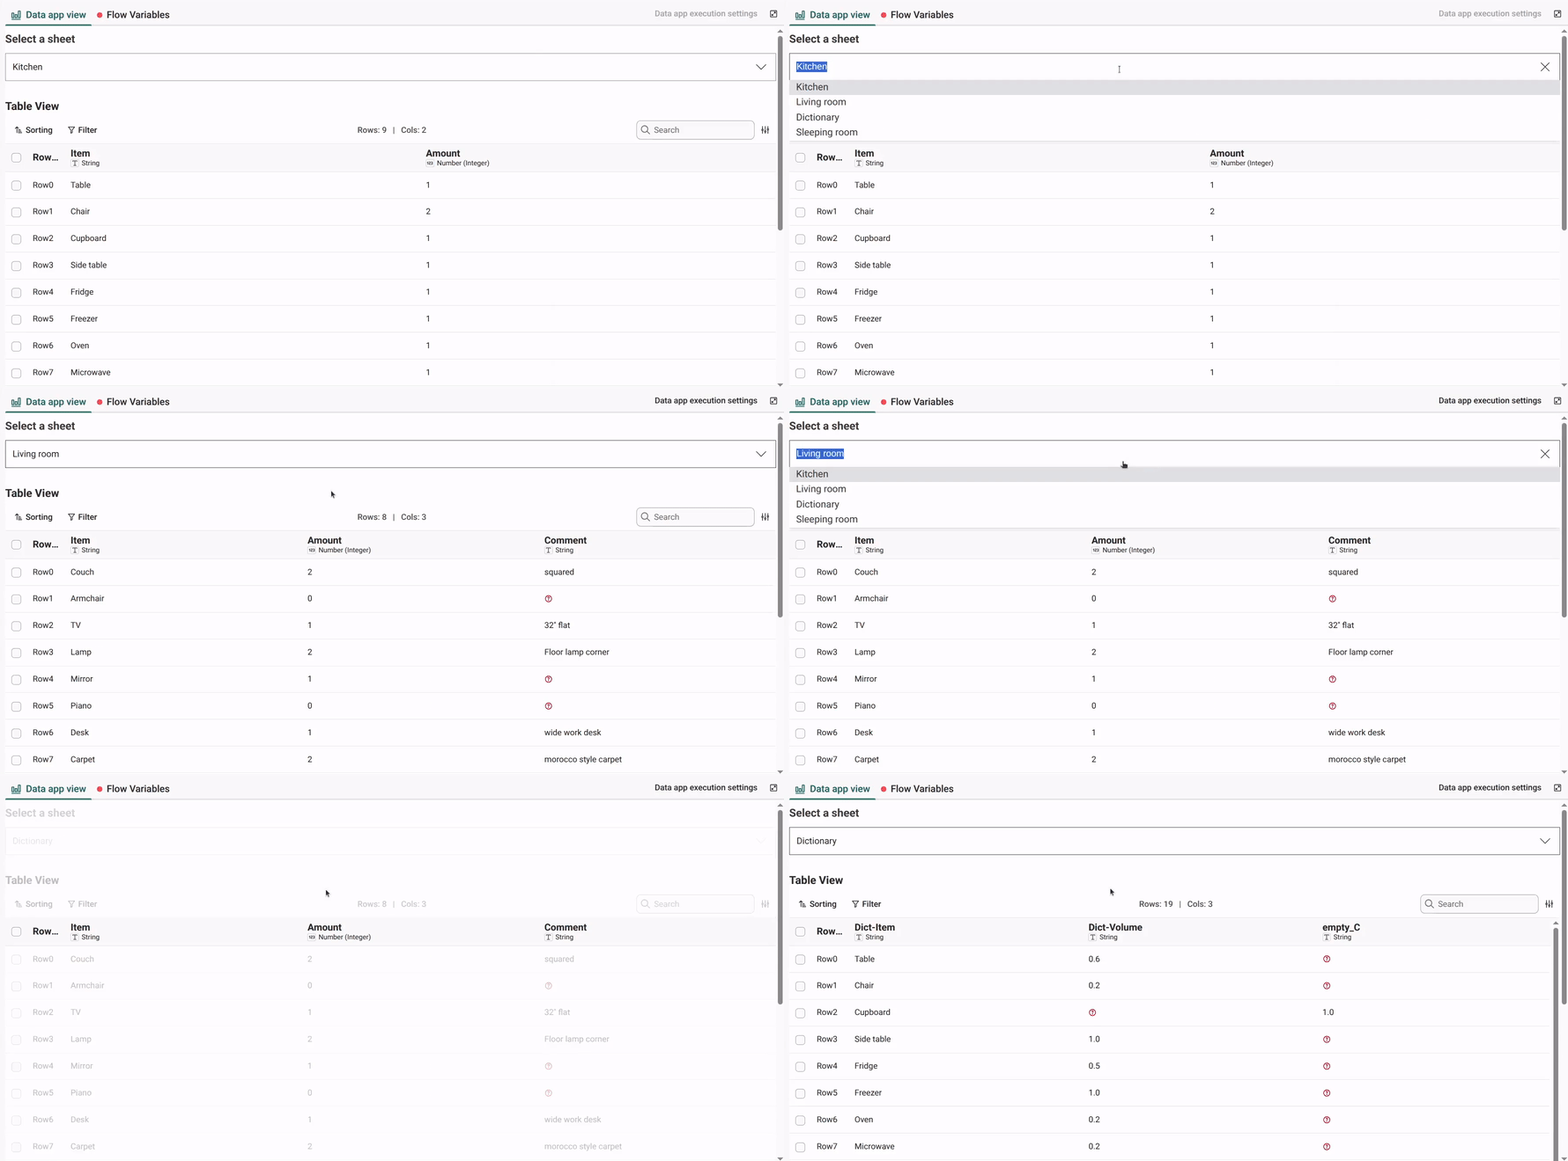
If the component doesn't execute successfully, open it to find the node that failed and see its error message. To learn how to open a component, see Step 5.
Step 5 — Adjust the layout
The layout editor controls how the views inside the component are arranged in the app.
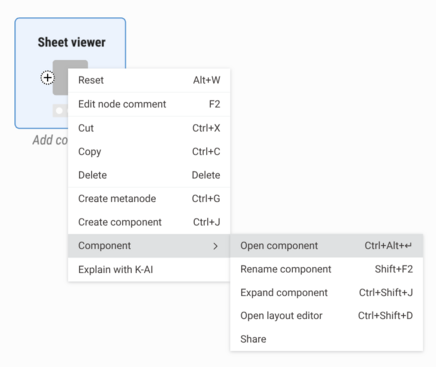
Open the component to see the nodes inside it. To open the component, right-click it in the workflow editor and select Component > Open component.
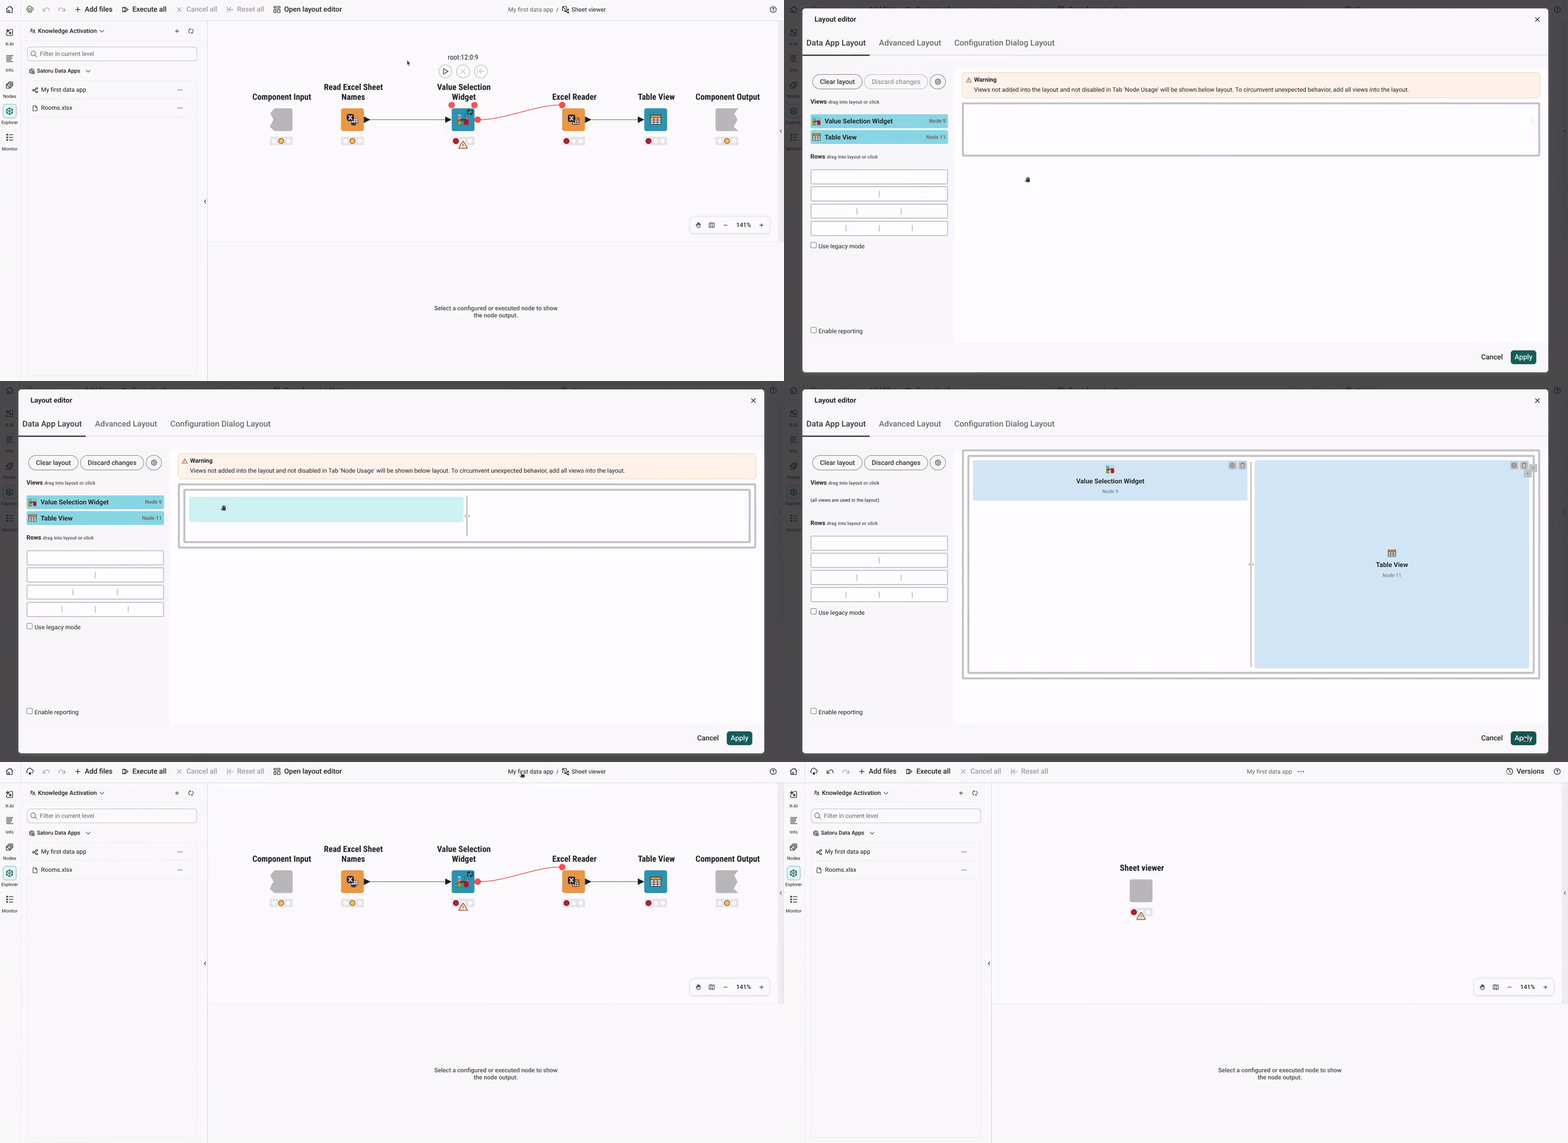
Click Open layout editor.
Arrange the layout in two columns. From the Rows section, drag the row with two columns into the layout frame. Then drag the Value Selection Widget into the left column and the Table View into the right column.
Click Apply. Then click My first data app in the title at the top of the workflow editor to return to the main workflow.
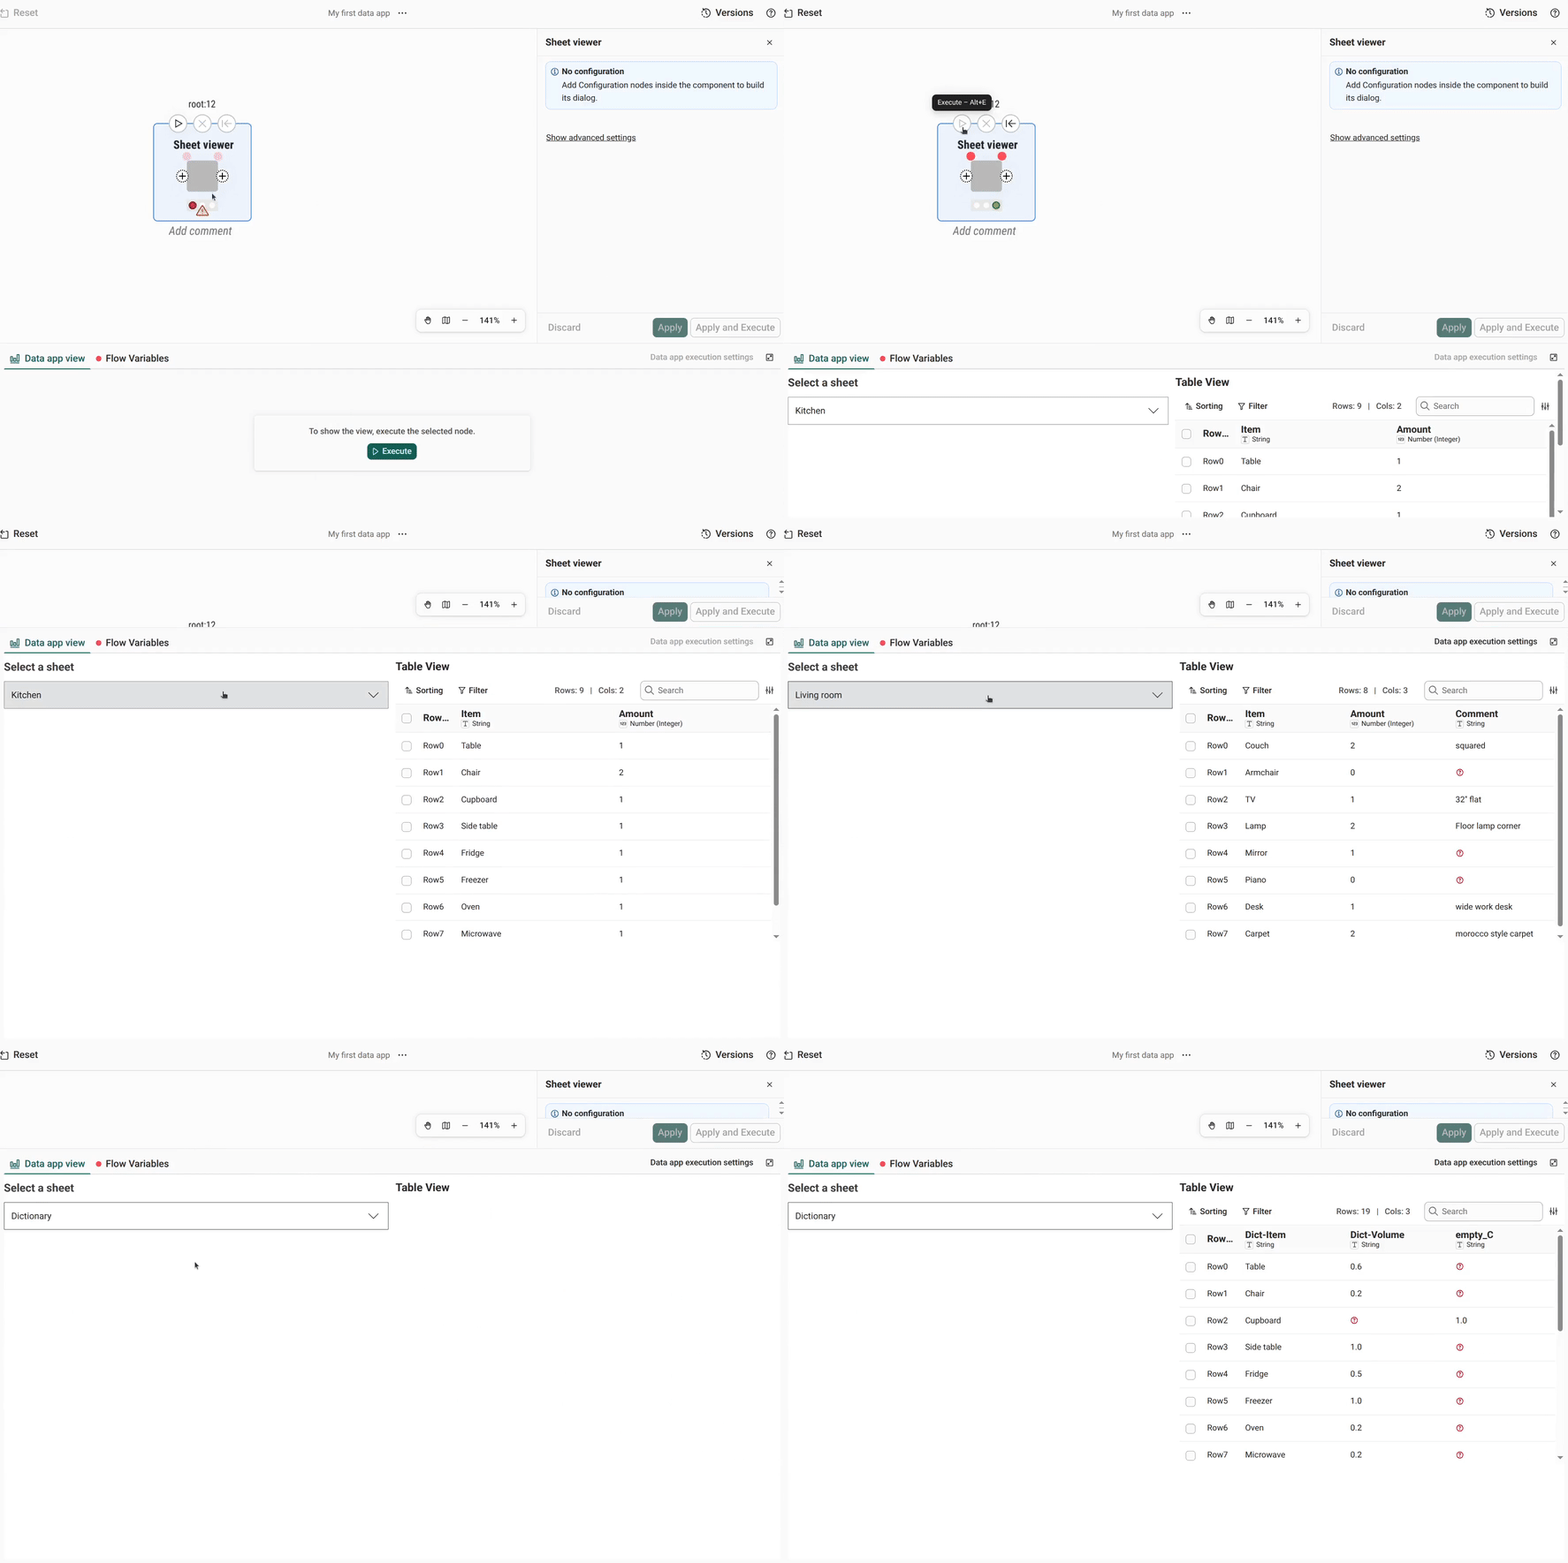
Click the play button above the component to execute it. When the component finishes executing, the Data app view tab shows the dropdown menu for choosing a sheet on the left and the table on the right.
Step 6 — Create a version
To deploy a workflow as a data app, you first need a version of it.
Before you create a version, reset your workflow so that it executes from beginning to end when the data app runs. At the top of the workflow editor, click Reset all. This returns all nodes in the workflow to the configured state and clears all results from the previous execution.

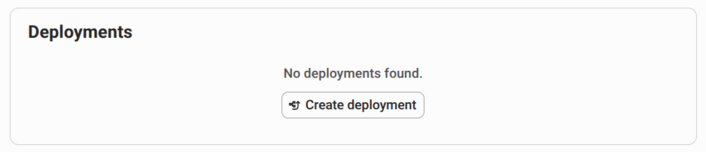
Go to the workflow page in your space. The Deployments panel on the right says that no deployments exist yet. It also says that you must create a version before you can create a deployment.
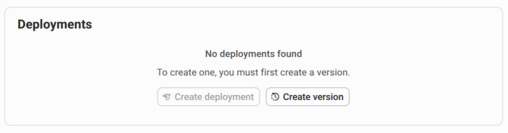
A version is a snapshot of your workflow at a specific point in time. You or your team members may keep updating the workflow. A version keeps the workflow exactly as it was when you created it, so your data app always runs the same workflow.
In the Deployments panel, click Create version. The Version history panel opens. For now, it lists only the Draft, which is the copy of the workflow you edit.
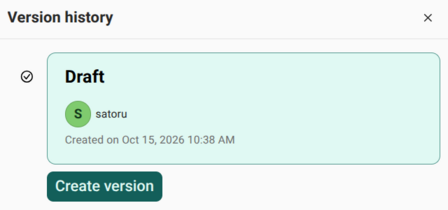
To create a version:
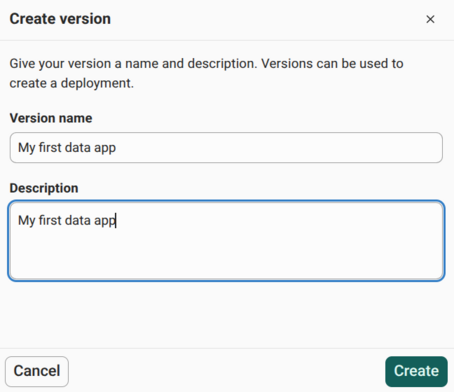
- Click Create version under the Draft. The Create version dialog opens.
- Under Version name, enter a name for your version, for example My first data app.
- Under Description, describe what this version contains.
- Click Create.
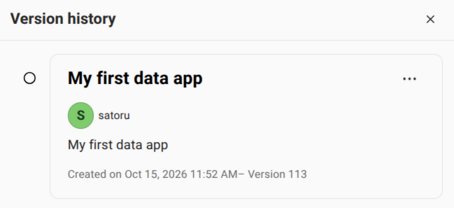
The Version history panel now lists the version you created. You're ready to deploy the workflow as a data app. To learn more about versions, see Create a version.
Step 7 — Deploy as a data app
With a version in place, you can deploy your workflow as a data app.
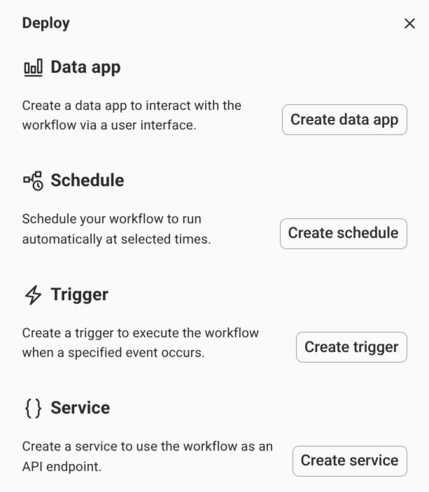
On the workflow page, click Create deployment in the Deployments panel, or click Deploy at the top of the page. The Deploy dialog opens and lists the deployment types.
In the Deploy dialog, click Create data app. The Create data app panel opens.
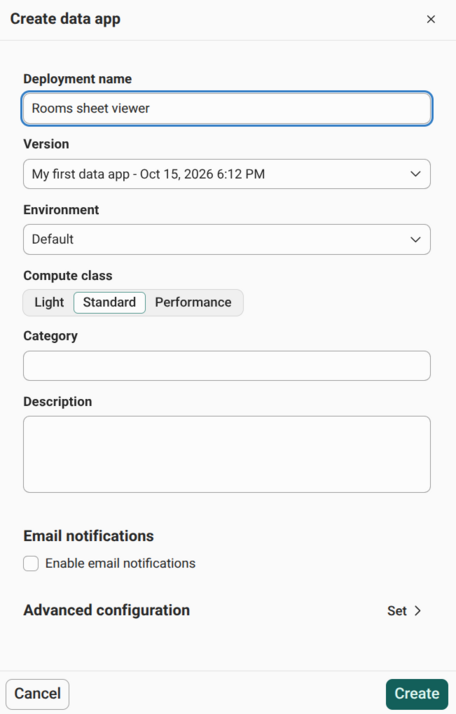
Set up the data app in the Create data app panel:
- Under Deployment name, enter a name for your data app, for example Rooms sheet viewer.
- Under Version, select the version you created in Step 6, for example My first data app.
- Keep the default settings for Environment and Compute class.
- Under Email notifications, leave Enable email notifications cleared.
- Click Create.
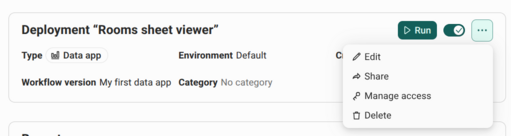
The Deployments panel on the workflow page now lists your data app.

Step 8 — Run the app
Run the data app in one of two ways:
From the workflow page: in the Deployments panel, click Run next to your data app.
With a link: copy the link to the data app and open it in a web browser. Share the link with others so they can run the app too. To copy the link:
In the Deployments panel, click the ... menu next to Run and select Share. The Share access panel opens.
Click Copy link to copy the link to the data app.
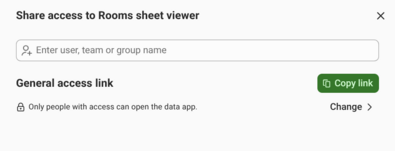
Only people with access to the data app can open it from the link. To give others access, enter the names of the individuals, teams, or groups in the Share access panel.
Whether you start it with the Run button or through a link, the data app opens in the browser. Choose a sheet from the dropdown menu. The table updates automatically to display the contents of the selected sheet.
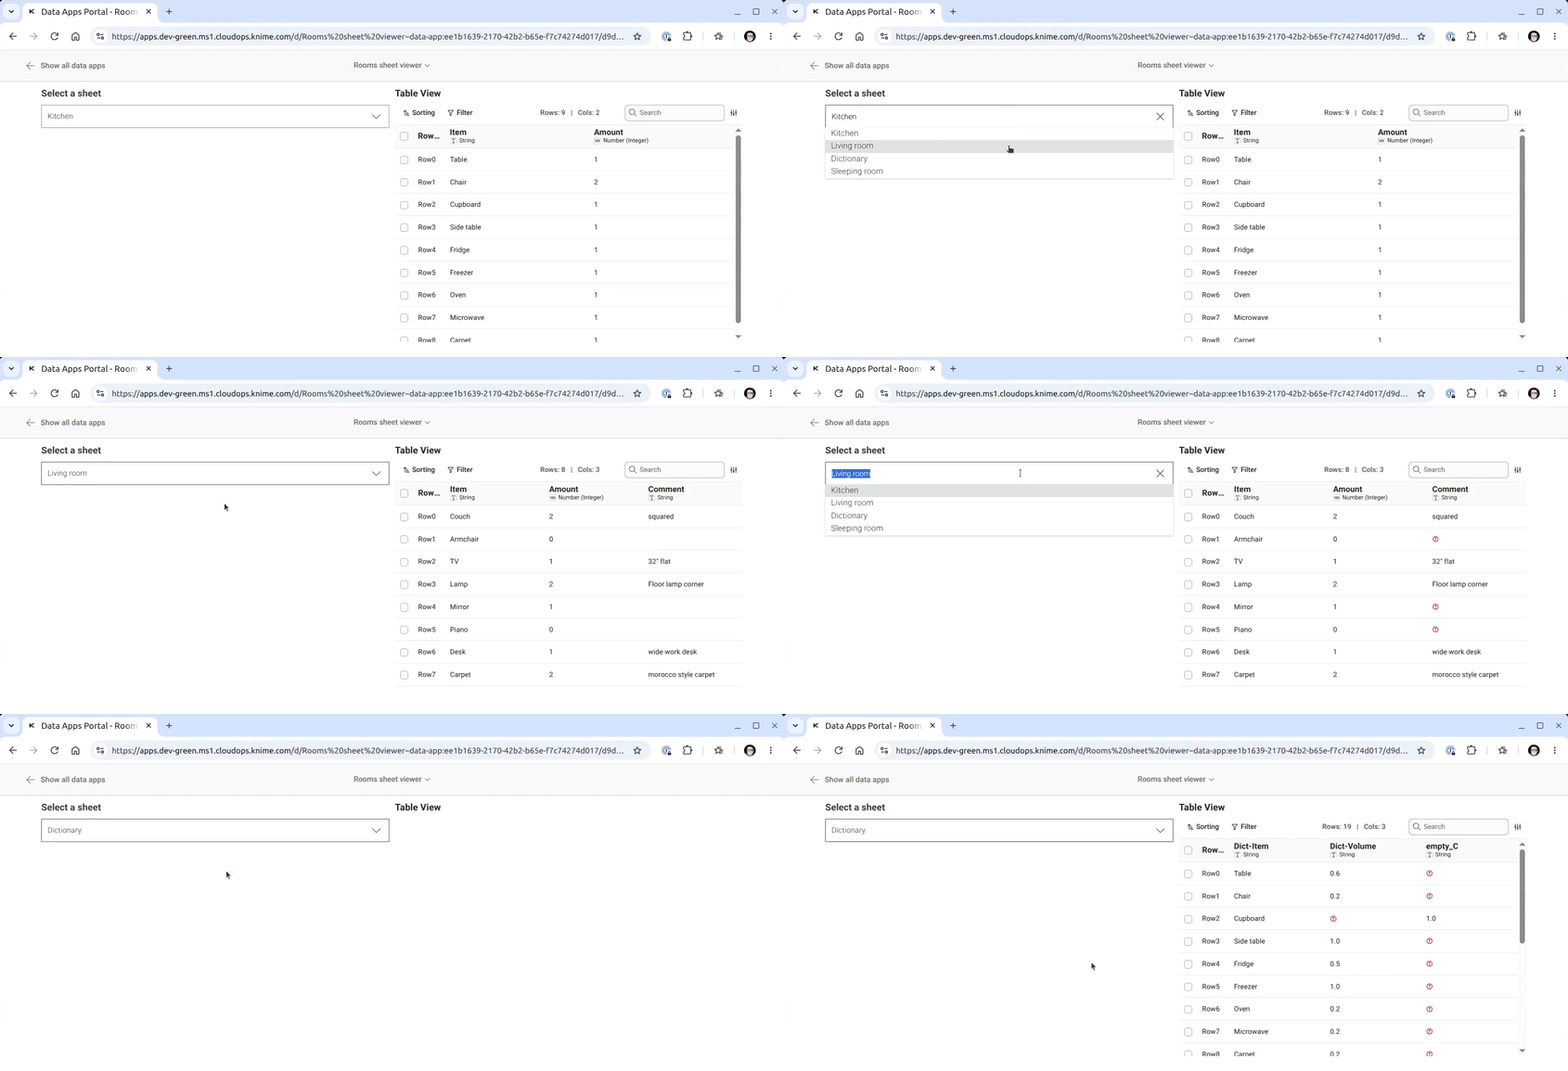
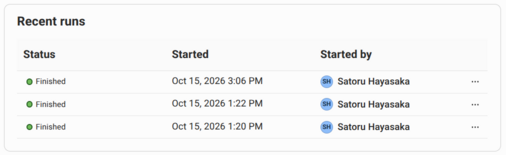
To close the data app, close the browser tab. The run terminates and then appears in the Recent runs panel on the workflow page. To see the outcome of a run, click the ... menu next to the run and select Inspect. The executed workflow opens in read-only mode, so you can explore each node's configuration and output from that run.
Summary
You turned a workflow into an interactive data app that runs in a web browser. You built the app from widgets and views, then combined them into a component and arranged its layout. You created a version of the workflow and deployed it as a data app.
Next steps
- Data apps: learn all the options for creating and managing data apps
- Components: learn more about components and their layouts
- Scheduling: run a workflow automatically on a schedule